Past IEM Features tagged: cape

Plenty of CAPE
11 Aug 2026 05:30 AMAtmospheric soundings are an important observational dataset useful for the forecasting the weather. The often twice-daily balloon launches by the National Weather Service capture vertical profiles of temperature, humidity, pressure, and wind. These profiles can be used to compute many useful indices to access the state of the troposphere. Once such index is Convective Available Potential Energy (CAPE), which is useful for understanding how much potential energy is available for near surface air if it were to be lifted vertically and become buoyant. The CAPE index is not necessarily easy to compute and subject to many interpretations and assumptions. The featured chart presents the CAPE index for surface based "parcels" based on soundings from NWS Davenport. The balloon launch Monday evening (00 UTC 11 August 2026) captured a very unstable environment with a CAPE index around 7,700 J/kg. Based on unofficial archives, this was the largest CAPE value for August and one of the largest on record for the site. Large CAPE values are often associated with a "cap" of warm air aloft that prevents storm development, so these environments do not automatically produce severe storms. Generally speaking, CAPE is not a lifting mechanism but an energy reservoir available to support explosive development should air be lifted to levels were it can "freely convect".
Voting:
Good: 16
Bad: 0
Abstain: 2
Tags: cape

Potential Instability
29 Jun 2012 05:46 AMVery hot air arrived in Iowa on Wednesday and muggy conditions were not far behind. With surface dew points near 80 degrees in some locations, the lower atmosphere is loaded with moisture. This moisture represents a potential energy source for thunderstorms as condensing water within clouds releases heat which promotes upward motion. The featured map presents a measure of this energy named convective available potential energy (CAPE). CAPE values above 2,000 are often considered significant for severe storms, so do the values shown above 6,000 in Southern Iowa on Thursday evening mean the world is coming to an end? The key word in the CAPE acronym is potential. Just as a watermelon sitting on the top of a sky scraper has a high potential to accelerate if pushed off the edge, the initial push needs to occur. For the atmosphere, weak winds and little convergence of air often means these profiles are left unrealized (nothing to give them a push).
Voting:
Good: 41
Bad: 6
Tags: cape

Instability returns
16 Mar 2011 05:57 AMThe featured chart presents the highest forecasted surface based convective available potential energy (CAPE) from the GFS model for a grid point near Ames since the first of the year. This variable gives an indication to the degree of instability in the atmosphere that helps to facilitate thunderstorms. Values above 1,000 typically are when the stronger storms are possible. While values shown are well below 1,000 for surface based air parcels, CAPE computed for elevated parcels is expected to be larger and will allow for some hail producing storms in the coming week.
Voting:
Good: 12
Bad: 2
Tags: cape
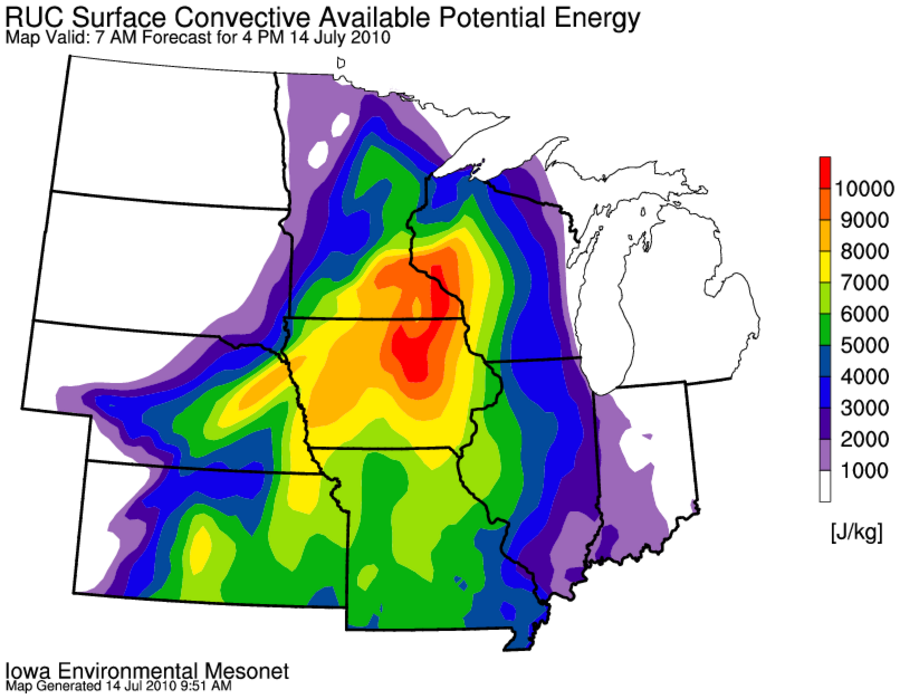
10,000+ CAPE
15 Jul 2010 07:09 AMThe featured map displays the RUC computer weather model forecast of surface based CAPE for yesterday afternoon. CAPE is a measure of the vertical accelerations possible if air is forced upward initially. Typically, values of around 3,000 indicate severe storms are possible. Due to the extreme surface temperatures and dew points yesterday, values were over 10,000 J/Kg. Values this large are extremely rare.
Voting:
Good: 35
Bad: 10
Tags: cape model