Past IEM Features tagged: 2017

2017 Temperature Range
01 Jan 2018 05:59 AMThe featured map displays the difference between the warmest and coldest temperature based on hourly high-resolution analysis produced by the Real-Time Mesoscale Analysis (RTMA). The coldest air of the entire year arrived last evening and helped to make this map even more extreme. Most of Iowa is shown in the 110 to 120 degree range. Even more extreme values are found just to our north and west with a few pixels over 140 degrees! There are many interesting features on the map with the moderating effects of the Great Lakes clearly evident and the decreased variability in temperature as you get further away from land.
Voting:
Good: 9
Bad: 0
Tags: 2017 rtma
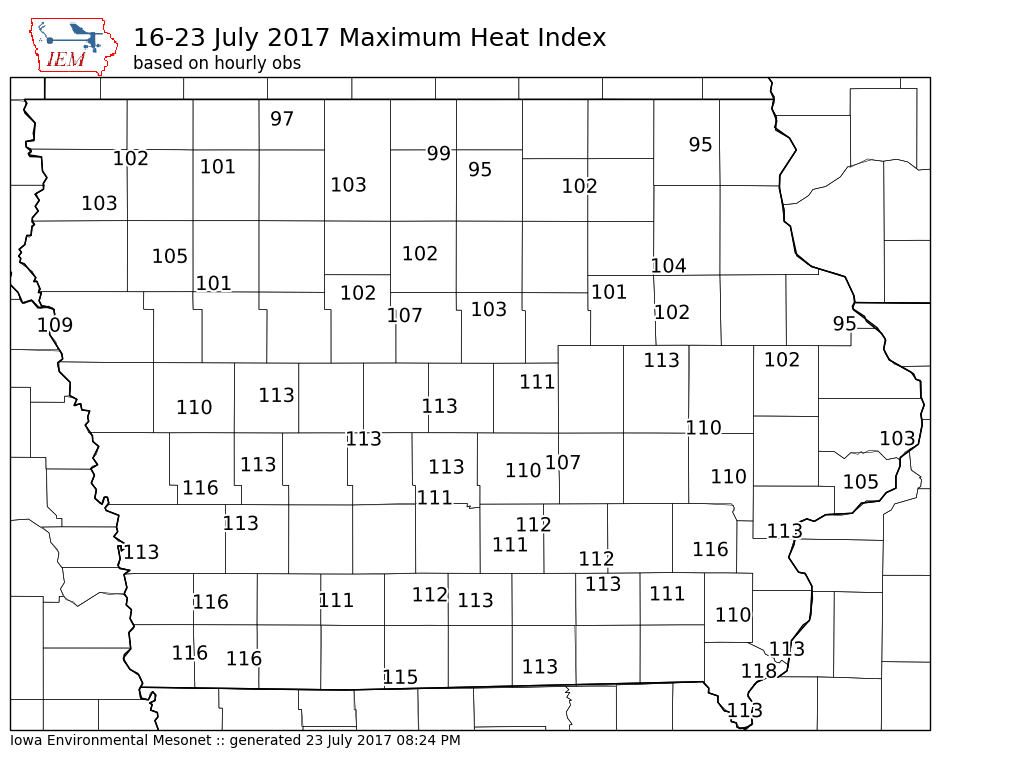
Highest Heat Index
24 Jul 2017 05:32 AMThe brutally warm and humid conditions of last week were thankfully mostly gone from the state for the past weekend. The combination of high temperatures and dew points created for extreme heat index values. The featured map displays computed maximum heat index values for the airport weather stations in the state over the past week. These are based on available hourly observations, so actual maximum values could have been a degree or two higher. The highest value shown is 118 degrees for Fort Madison on 20 July. The forecast for this week has warm conditions, but nothing like what we experienced last week.
Voting:
Good: 19
Bad: 0
Tags: jul17 2017

Continued Snowcover Difference
03 Feb 2017 05:33 AMAbout a month ago, the same map was featured showing a significant north to south difference in the state with the number of days with at least one inch of snow depth covering the ground. Since then, the most significant snowfall only exasperated the difference with over 40 days of difference north to south over the state. The best chance of snowfall next week looks again to be confined to the northern part of the state.
Voting:
Good: 15
Bad: 1
Tags: 2017