Past Features
This page lists out the IEM Daily Features for a month at a time. Features have been posted on most days since February 2002. List all feature titles.
Wed Jan 01, 2025
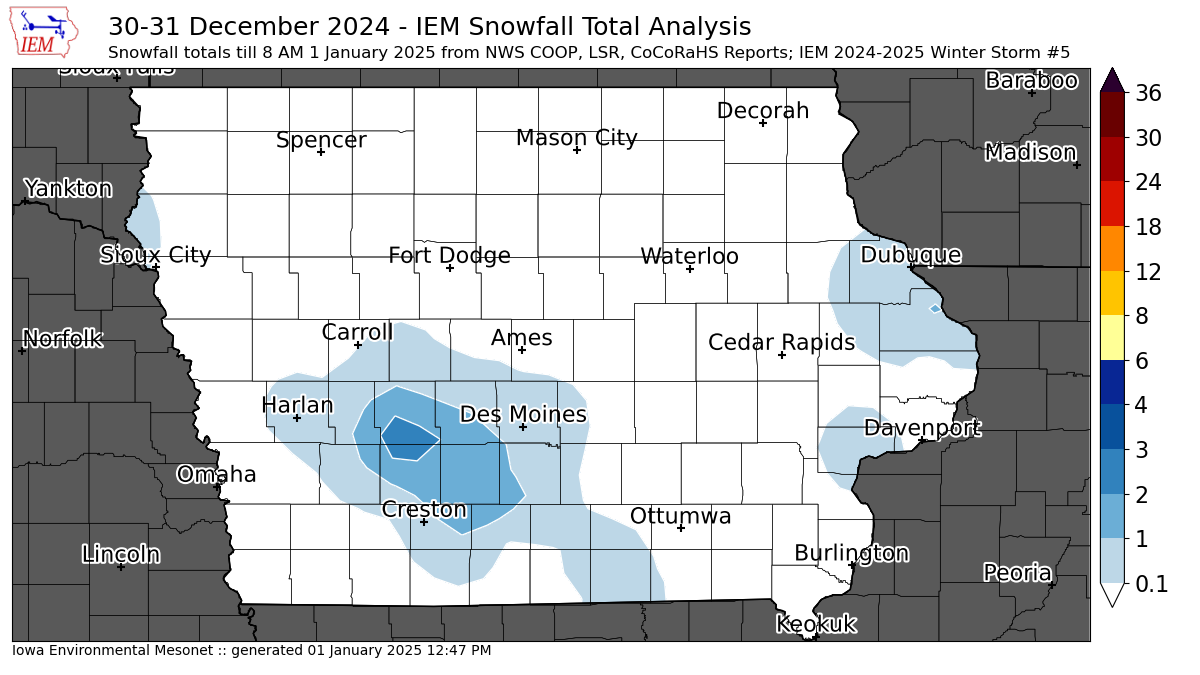
'24-'25 Winter Storm #5
01 Jan 2025 12:54 PM
While most of the precipitation from the storm impacting the state Monday into Tuesday fell as rain, a few locations picked up measurable snowfall with an isolated area west of Des Moines picking up over two inches. The featured map presents available NWS COOP, Local Storm Reports, and CoCoRaHS reports over the past two days. Some of the snow did quickly melt with the change over to rain, so totals were difficult to measure and report. Our weather pattern looks to remain active to start off 2025 with the next accumulating snow storm arriving Thursday and a likely bigger storm to end the upcoming weekend.
Voting: Good - 13 Bad - 0
Tags: winter2425
Thu Jan 02, 2025

'24-'25 Winter Storm #6
02 Jan 2025 10:28 PM
A compact and quick moving winter storm dumped a stripe of two to four inches on Thursday between roughly Sioux City to Davenport. The featured map presents an analysis of mostly NWS Local Storm Reports as much of the once-daily COOP data will be arriving Friday morning. So the map will be updated once those additional reports arrive along with any CoCoRaHS reports. The map also plots the three Snow Squall Warnings polygons issued by NWS Des Moines as intense snowfall rates impacted the morning work commute. Attention is quickly turning to a much larger storm complex forecast to arrive late this weekend, with the largest snowfall totals forecast to clip southern Iowa along with a sharp gradient in totals to the north.
Voting: Good - 19 Bad - 5
Tags: winter2425
Mon Jan 06, 2025
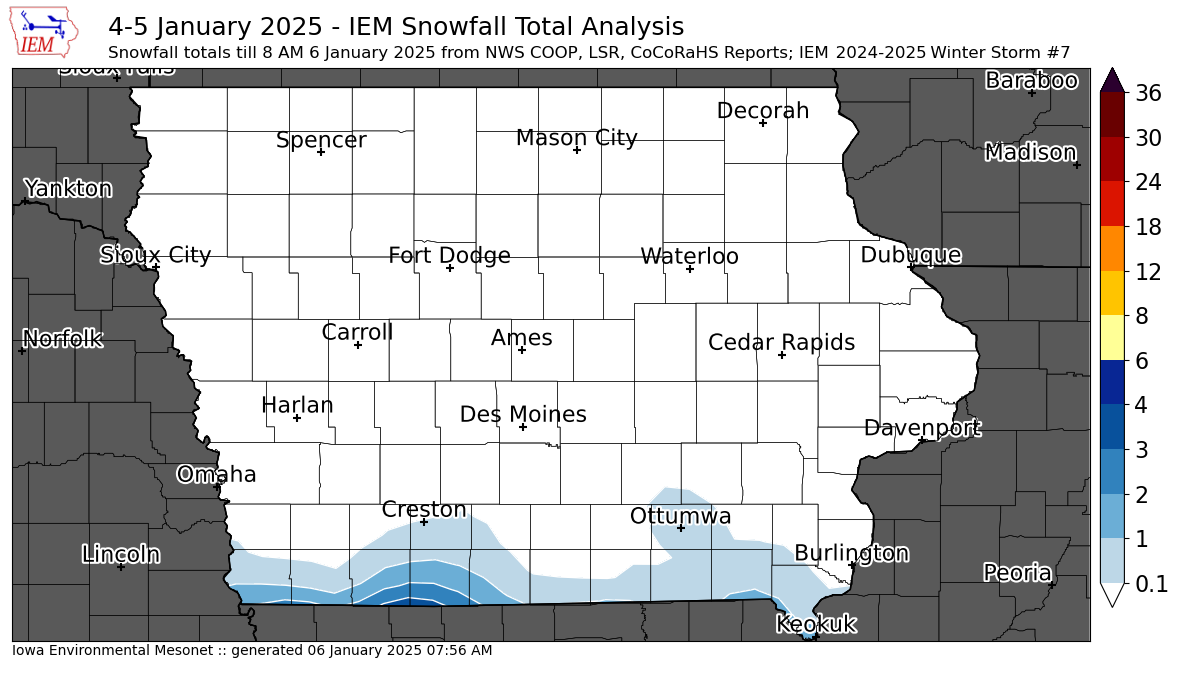
'24-'25 Winter Storm #7
06 Jan 2025 08:01 AM
A major winter storm brought freezing rain and heavy snow from Kansas to now D.C. Iowa barely got clipped by the event with a sharp northern side gradient to the heaviest snowfall totals as dry air over Iowa fought off the snow. The featured analysis is struggling to show the tight gradient that exists over the southern tier of Iowa counties with a limited number of reports in the area. Our recently active weather pattern looks to settle down a bit this week with seasonal cold air in place and not much in the way of precipitation chances.
Voting: Good - 13 Bad - 0
Tags: winter2425
Tue Jan 07, 2025

January Brisk Winds By Temp
07 Jan 2025 05:30 AM
Cold temperatures and a brisk wind created for sub zero wind chill temperatures Monday morning across most of Iowa. The featured chart looks into the frequency of having a wind speed of at least 10 knot (~12 MPH) for a given air temperature during January for Ames. The signal shown nicely illustrates the relationship between the two with the most interesting things happening at the temperature extremes. For the warmest temperatures, the frequency increases as the typical weather pattern needed to support such elevated temperatures involves the transport of warmer air masses from the south and mixing down of warmer air aloft. For the coldest temperatures, the micro-climate of the station favors "cold air drainage" situations, which usually need reduced wind speeds. There are also situations when transport of arctic air is involved, so frequencies do not necessarily go to zero at the coldest of temperatures.
Voting: Good - 7 Bad - 0
Generate This Chart on Website
Wed Jan 08, 2025
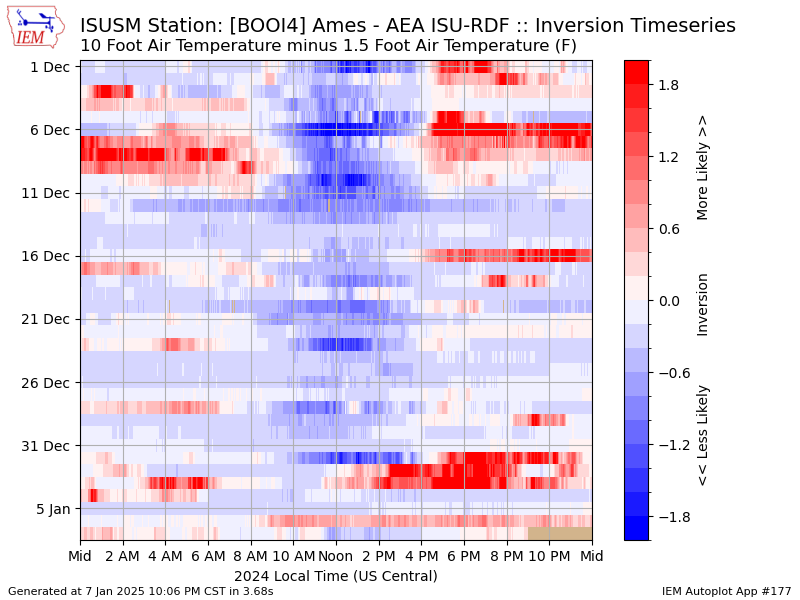
Recent Inversion Timing
08 Jan 2025 05:30 AM
Iowa State University has three of its "Soil Moisture Network" stations outfitted with additional temperature and wind sensors to help diagnose near surface temperature inversions. The primary application of this data is for agricultural spraying operations, but for meteorologists, the data can be interesting to look at any time of the year. The featured plot presents the difference between the 10 foot and 1.5 foot above ground level air temperature for a site near Ames. Red shading indicates that the 10 foot temperature is warmer. The plot shows the minute by minute values since 1 December. Of interest are many of the recent days since the arrival of modest snow cover. The presence of snow is a game changer for the surface energy budget with the primary impact being the redirection of much of the sun's inbound energy back into the atmosphere instead of heating the ground and helping to warm near surface air temperatures.
Voting: Good - 10 Bad - 1
Generate This Chart on Website
Thu Jan 09, 2025
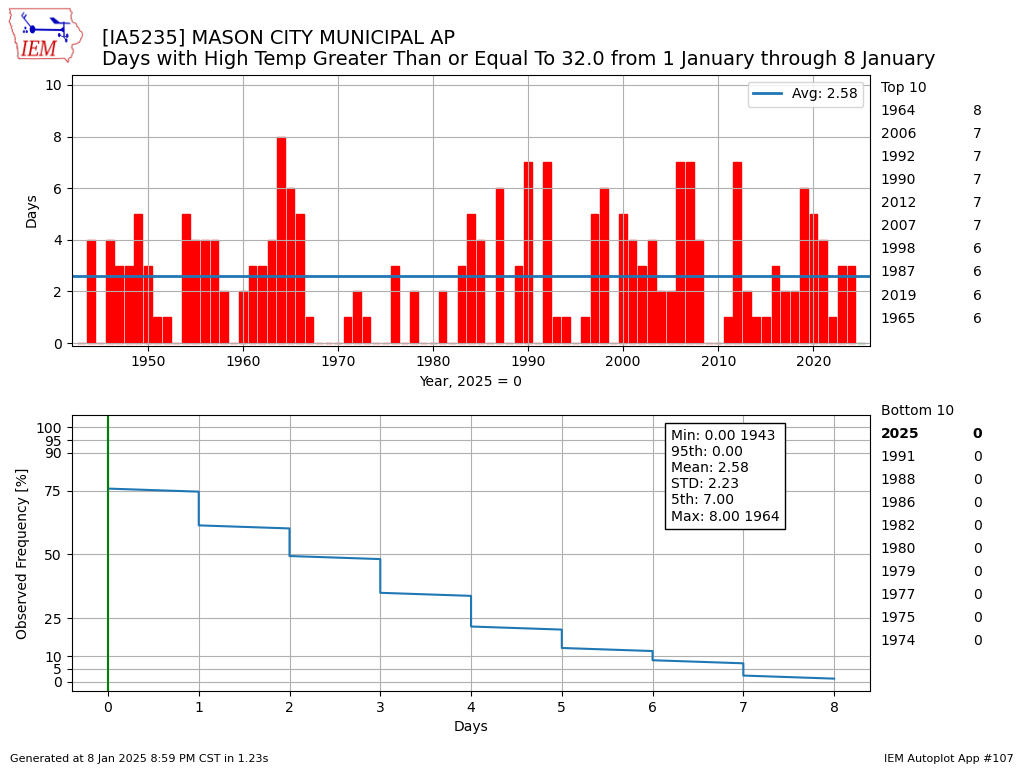
Frozen start to 2025
09 Jan 2025 05:30 AM
For some parts of the state, the first eight days of 2025 have been below freezing. One such example is Mason City. The featured chart presents the number of days during the first eight days of each year that the high temperature was above 32°F. The zero for 2025 is the first since 2010, but roughly 1/4 of the years on record have had a similar start to this year. While this plot doesn't correlate these numbers with snow depth, a manual calculation shows that nearly all of those years with six to eight days had no snow cover and vice versa, most years with zero had snow cover.
Voting: Good - 10 Bad - 0
Generate This Chart on Website
Fri Jan 10, 2025
GeoTIFF Export
10 Jan 2025 05:30 AM
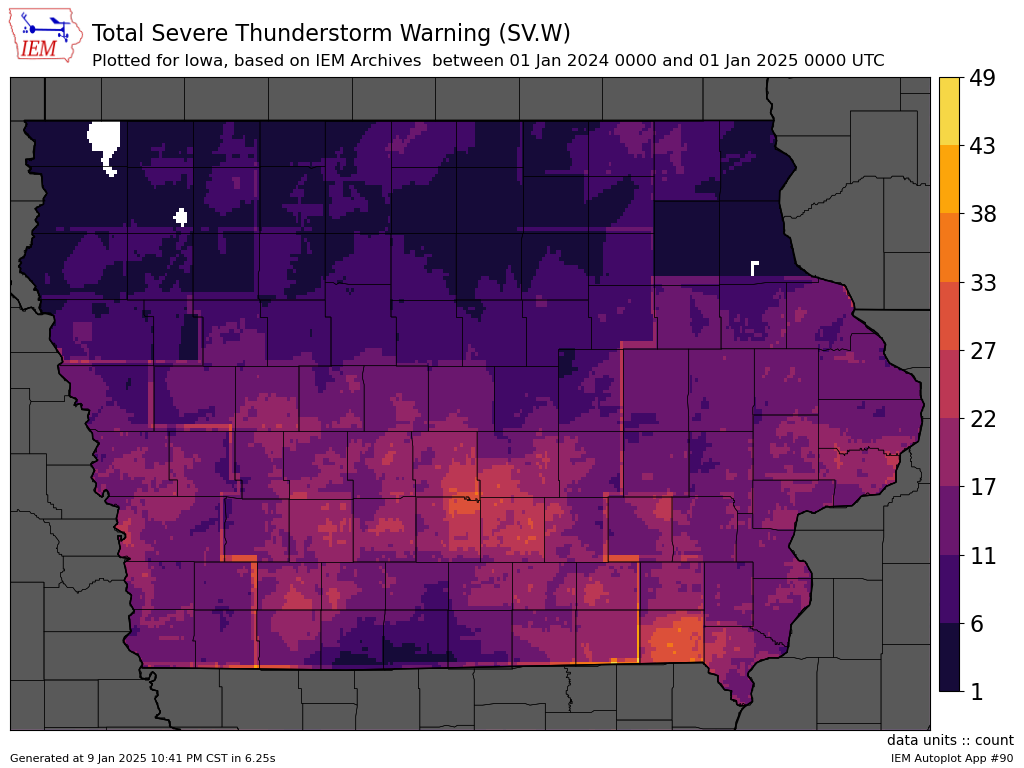
The IEM Autoplot tool has two general goals. The first is to generate visualizations of often complex datasets on-the-fly with considerable freedom given to the user to customize the presentation. The second is to give the user the option to download the raw data behind the visualization to allow for usage within their visualization or statistical software package of choice. To further support the extensibility goal, a number of autoplots that generate maps of grid based data are now able to export that data as a GeoTIFF. A GeoTIFF is a common and open GIS format for raster data. Note that the export is the raw data as a single band of floating point data values, not the visualization with color ramp and associated cartography. So today's featured plot is a mundane heatmap of NWS Severe Thunderstorm Warning polygons over Iowa for 2024. You can export the raster of event counts as a GeoTIFF and do further analysis to your heart's content. The option to generate these GeoTIFFs will be found as a button link below the generated maps within the autoplot tooling. As always, feedback on the autoplots and functionality is appreciated!
Voting: Good - 16 Bad - 41
Generate This Chart on Website
10 Jan 2025 05:30 AM
The IEM Autoplot tool has two general goals. The first is to generate visualizations of often complex datasets on-the-fly with considerable freedom given to the user to customize the presentation. The second is to give the user the option to download the raw data behind the visualization to allow for usage within their visualization or statistical software package of choice. To further support the extensibility goal, a number of autoplots that generate maps of grid based data are now able to export that data as a GeoTIFF. A GeoTIFF is a common and open GIS format for raster data. Note that the export is the raw data as a single band of floating point data values, not the visualization with color ramp and associated cartography. So today's featured plot is a mundane heatmap of NWS Severe Thunderstorm Warning polygons over Iowa for 2024. You can export the raster of event counts as a GeoTIFF and do further analysis to your heart's content. The option to generate these GeoTIFFs will be found as a button link below the generated maps within the autoplot tooling. As always, feedback on the autoplots and functionality is appreciated!
Voting: Good - 16 Bad - 41
Generate This Chart on Website
Mon Jan 13, 2025
January Daily Climo
13 Jan 2025 05:40 AM
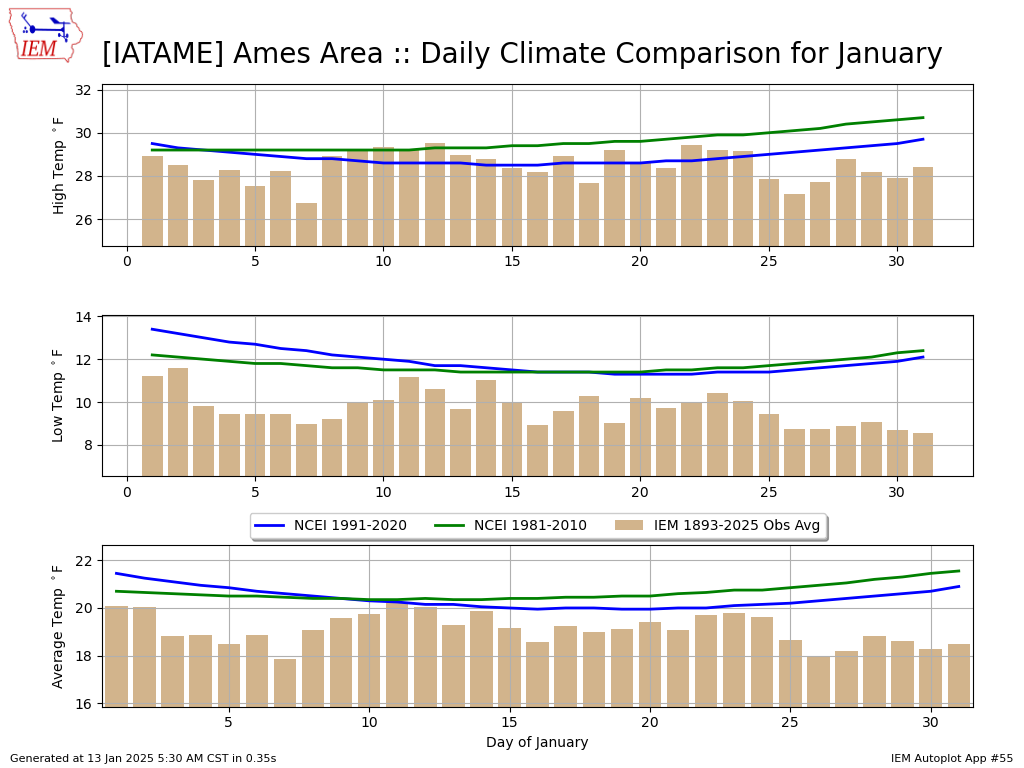
The featured chart presents daily high, low, and average temperature climatologies for Ames during January. The lines represent the two most recent official climatologies from NCEI. These 30 year averages are updated once per decade. The bars presents the simple computed average based on period of record observations. The immediate difference between the two climatology datasets is explained by NCEI attempting to smooth out day to day variability due to individual weather events. Focusing on the NCEI lines, it is interesting to denote the subtle differences between the high and low temperature lines and how that impacts the overall average between the two. Our average high temperature is just starting to creep upwards, while our low temperature still has about a week to go before bottoming out. This difference is another example of thermal inertia as increasing solar inputs help to increase day time temperatures slightly, but more time is needed for the change to be felt with low temperatures.
Voting: Good - 10 Bad - 1
Generate This Chart on Website
13 Jan 2025 05:40 AM
The featured chart presents daily high, low, and average temperature climatologies for Ames during January. The lines represent the two most recent official climatologies from NCEI. These 30 year averages are updated once per decade. The bars presents the simple computed average based on period of record observations. The immediate difference between the two climatology datasets is explained by NCEI attempting to smooth out day to day variability due to individual weather events. Focusing on the NCEI lines, it is interesting to denote the subtle differences between the high and low temperature lines and how that impacts the overall average between the two. Our average high temperature is just starting to creep upwards, while our low temperature still has about a week to go before bottoming out. This difference is another example of thermal inertia as increasing solar inputs help to increase day time temperatures slightly, but more time is needed for the change to be felt with low temperatures.
Voting: Good - 10 Bad - 1
Generate This Chart on Website
Tue Jan 14, 2025

S California Fire Wx
14 Jan 2025 05:30 AM
In addition to convective outlooks, the Storm Prediction Center issues a fire weather outlook. The featured chart presents the daily maximum SPC fire weather outlook for the NWS Los Angeles forecast area since 2006. The chart shows the fire weather season mostly confined to the fall and early winter season, but events can happen about any time of year. The recent combination of down-slope wind and dry vegetation have materialized dangerous fire weather conditions. SPC has issued a couple of "Extreme" categorical outlook risks over the past week, which is something akin to the convective "High" risk that us Iowans have some experience with. Unfortunately, the fire weather risk looks to continue this week for the area with no precipitation forecast for the near term.
Voting: Good - 11 Bad - 0
Tags: fire
Generate This Chart on Website
Wed Jan 15, 2025
'24-'25 Winter Storm #8
15 Jan 2025 05:30 AM
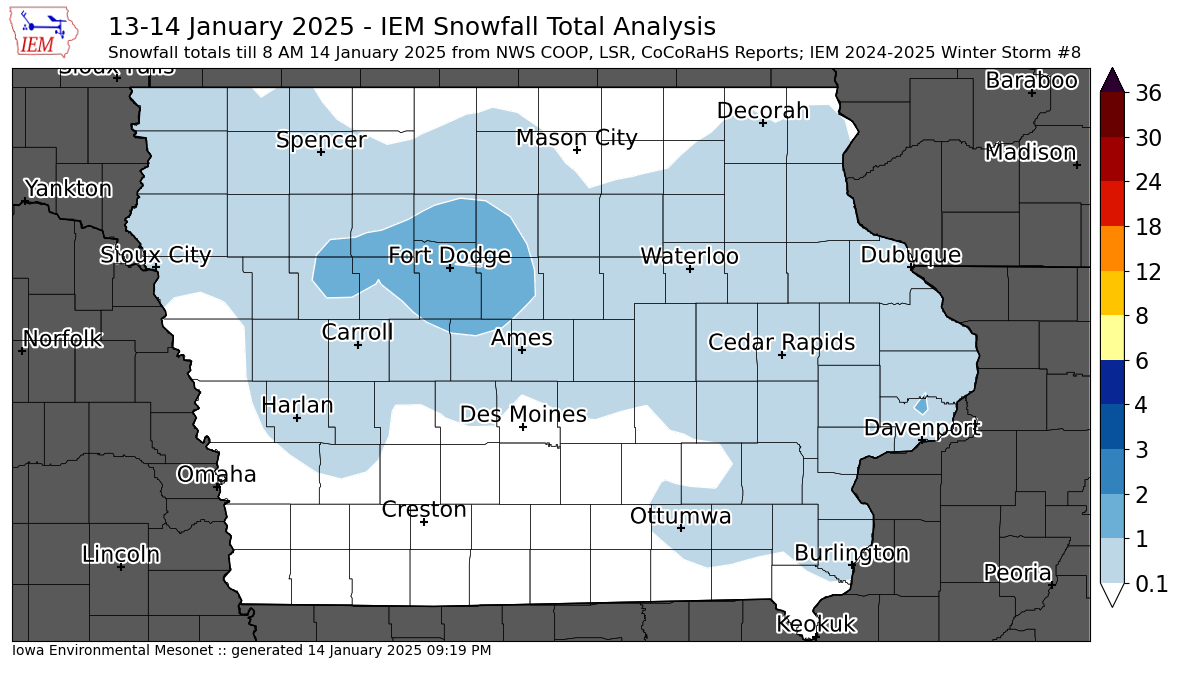
While not much for a winter storm, an isolated area near Fort Dodge reported the IEM-analysis-map-arbitrary total of at least two inches of snow overnight into Tuesday morning. Totals an inch or less were common over the rest of the state. Other reports of an inch were found in a line from Fort Dodge to Davenport. The forecast continues to show warming temperatures for the rest of this week before a significant cold air outbreak arrives for early next week.
Voting: Good - 13 Bad - 2
Tags: winter2425
15 Jan 2025 05:30 AM
While not much for a winter storm, an isolated area near Fort Dodge reported the IEM-analysis-map-arbitrary total of at least two inches of snow overnight into Tuesday morning. Totals an inch or less were common over the rest of the state. Other reports of an inch were found in a line from Fort Dodge to Davenport. The forecast continues to show warming temperatures for the rest of this week before a significant cold air outbreak arrives for early next week.
Voting: Good - 13 Bad - 2
Tags: winter2425
Thu Jan 16, 2025
Snowfall Departure
16 Jan 2025 05:30 AM
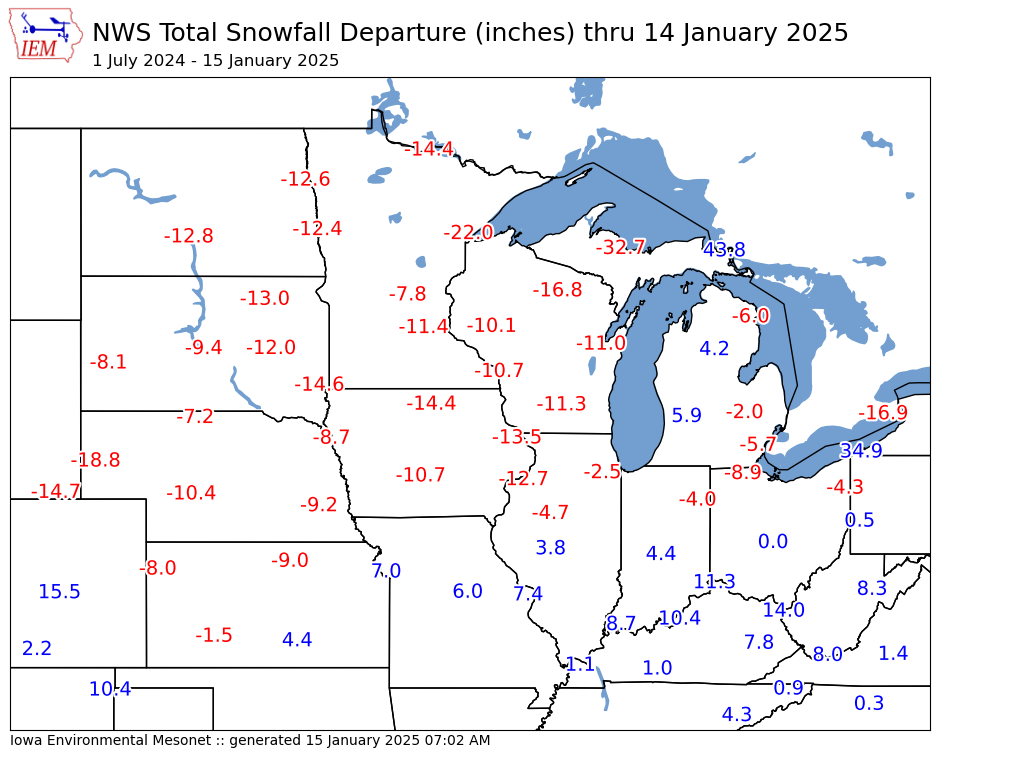
The featured map presents season to date snowfall departures for NWS Daily CLImate reporting sites. An interactive map version of this data is available as well. The map shows the regional contrast in accumulated snow with above average values confined to the southern portion of the Midwest and a few spots that receive lake effect near the Great Lakes. With an upcoming and brief stretch of above freezing temperatures, a good chunk of what snow cover that exists over Iowa will melt. This will be followed by a period of deep freeze weather with highs struggling in the single digits. Such cold weather without any insulating snow cover can have impacts for frost depth penetration within the soil and over-wintering hardiness of some plants.
Voting: Good - 9 Bad - 1
Generate This Chart on Website
16 Jan 2025 05:30 AM
The featured map presents season to date snowfall departures for NWS Daily CLImate reporting sites. An interactive map version of this data is available as well. The map shows the regional contrast in accumulated snow with above average values confined to the southern portion of the Midwest and a few spots that receive lake effect near the Great Lakes. With an upcoming and brief stretch of above freezing temperatures, a good chunk of what snow cover that exists over Iowa will melt. This will be followed by a period of deep freeze weather with highs struggling in the single digits. Such cold weather without any insulating snow cover can have impacts for frost depth penetration within the soil and over-wintering hardiness of some plants.
Voting: Good - 9 Bad - 1
Generate This Chart on Website
Fri Jan 17, 2025

January Temperature Range
17 Jan 2025 05:30 AM
Temperatures warmed nicely on Thursday and with the slightly lengthening days, perhaps some of you were starting to dream of spring! Of course, we very much have a majority of the winter season yet to come and the near term forecast has the coldest air of the season arriving this very weekend. Today's featured chart checks in on the observed temperature range during January for Ames. The top panel shows the yearly maximum high temperature, middle panel presents the minimum low temperature, and finally the bottom panel shows the difference between the two (the range). Each dataset is fit with a simple average and a trailing 30 year average. Thanks to the lack of significant warmth and cold this year, the range is currently near the lowest of what has been observed on record. January is only half over, so there is plenty of time for each extreme to be exceeded and the range increased.
Voting: Good - 9 Bad - 18
Generate This Chart on Website
Mon Jan 20, 2025
Weekend Dive
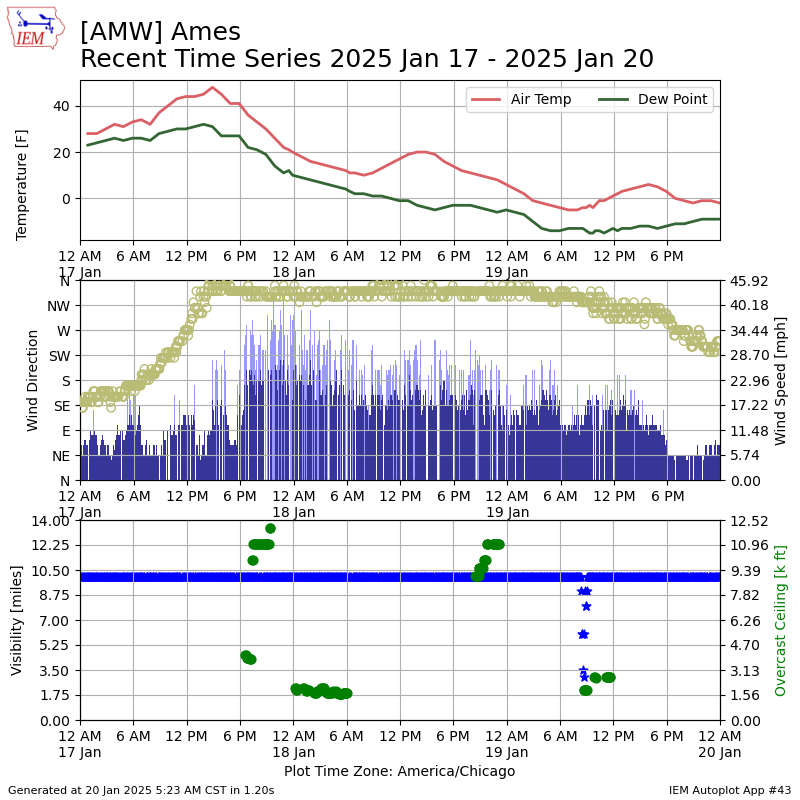
20 Jan 2025 05:29 AM
The featured chart presents a meteogram of observations for the Ames Airport on Friday though Sunday. After reaching near 50°F on Friday, temperatures took a dive through the weekend with highs only in the single digits on Sunday. The cold temperatures combined with a strong northerly wind to create dangerous wind chill values, which prompted offices like NWS Des Moines to issue their first Cold Weather Advisory. The good news is that temperatures will warm this week, but only to levels slightly above freezing.
Voting: Good - 7 Bad - 0
Generate This Chart on Website
Tue Jan 21, 2025
Expansive Winter Headlines
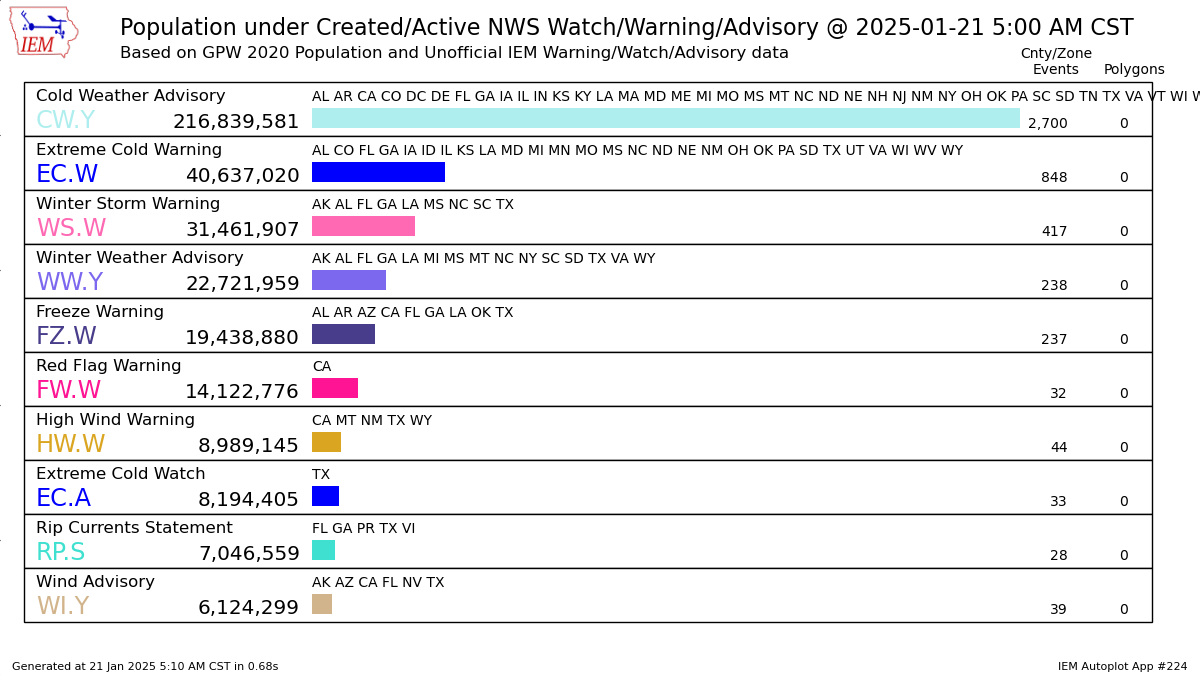
21 Jan 2025 05:21 AM
A very robust and large area of cold air has a tight grip on most of the contiguous US this Tuesday morning. The featured chart presents an unofficial IEM accounting of NWS headline statistics presently active. For each headline, a population estimate is presented along with a list of impacted states and the number of counties/forecast zones affected. The spatial extent of the cold can be readily seen with alerts like Winter Storm Warning shown in Louisiana and Florida along with Extreme Cold Warnings from Minnesota to Florida! While not shown on this top 10 listing, a Blizzard Warning was issued this morning by Lake Charles, Louisiana for locations along the gulf coast! For Iowa, we are dealing with very cold air temperatures and wind dropping wind chill readings to below -30°F for much of northern Iowa.
Voting: Good - 17 Bad - 22
Generate This Chart on Website
Wed Jan 22, 2025
Yearly Min Wind Chill
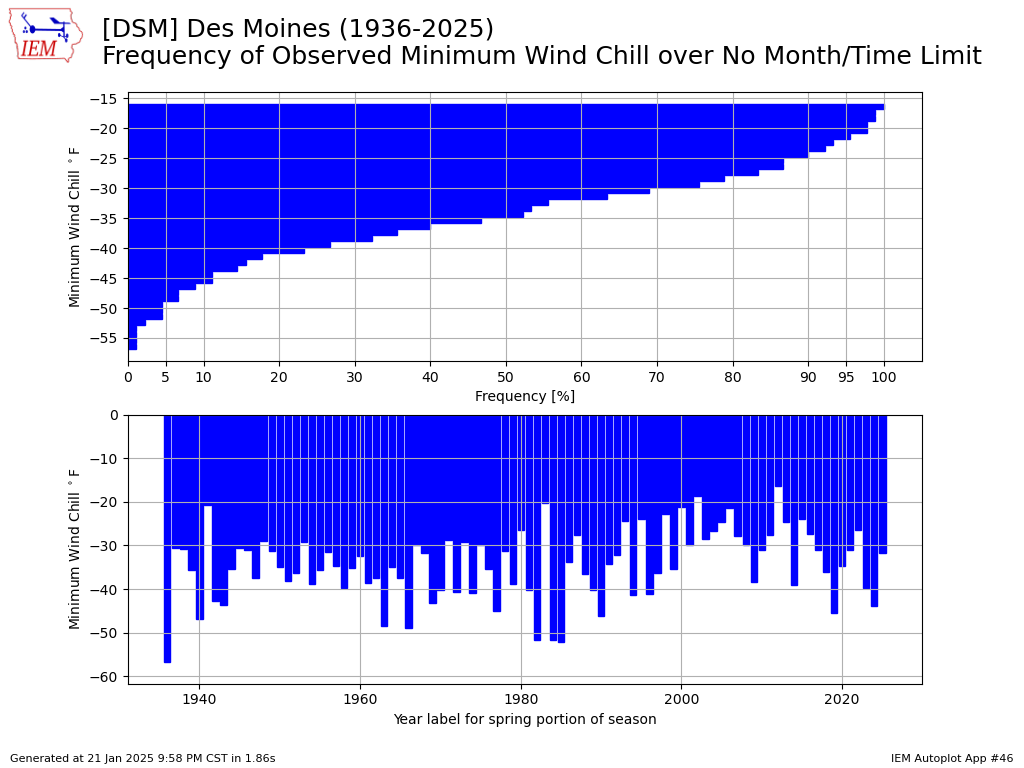
22 Jan 2025 05:30 AM
Temperatures continue to rebound after bottoming out Tuesday morning with unpleasant combination of bitter cold temperatures and a brisk wind. The wind chill reading at the Des Moines Airport reached a minimum of -32°F at about midnight, based on the hourly observations. The featured chart presents the yearly seasonal minimum wind chill reading, using the present day equation, for Des Moines. This year's value is slightly above the previous two years and the top panel indicates that roughly 70% of previous years have had a colder reading.
Voting: Good - 17 Bad - 0
Tags: windchill
Generate This Chart on Website
Thu Jan 23, 2025
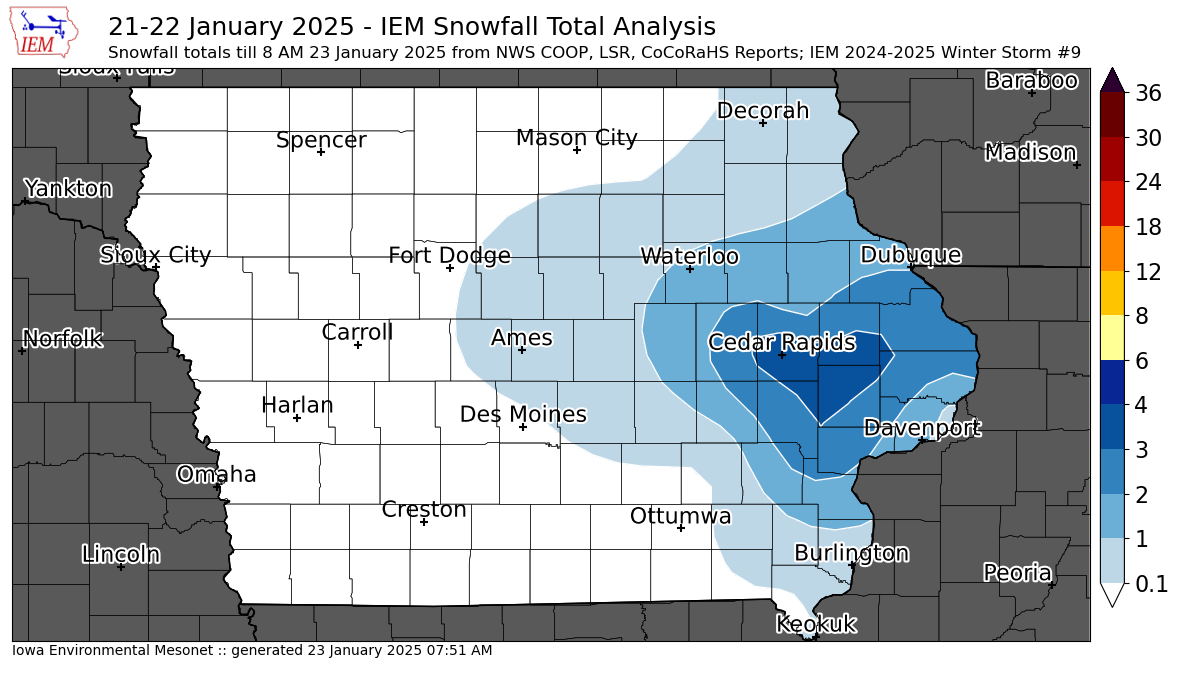
'24-'25 Winter Storm #9
23 Jan 2025 07:56 AM
After a daytime on Wednesday of mostly light snowfall amounts, a more robust area of snow setup over eastern Iowa during the early evening hours and a number of locations around Cedar Rapids reported two to four inches of snow. The featured map presents a smoothed analysis of available NWS and CoCoRaHS repors. A cold front swept the state overnight, increasing winds and dropping temperatures with sub zero wind chill readings present over the state this Thursday morning. The good news, for those that do not like the cold, is that temperatures will rebound for the weekend with plenty of above freezing time to start off next week.
Voting: Good - 12 Bad - 1
Tags: winter2425
Fri Jan 24, 2025

Soil Response to Cold
24 Jan 2025 05:30 AM
The recent stretch of cold air temperatures and a lack of snow cover raised some concern for rapid increase of frost depth. Today's featured chart looks into this by presenting soil temperatures at depth from the ISU Soil Moisture Network station near Ames. This station has an infield sensor array with the shallowest depth at 14 inches (to allow for field tillage above it) and the deepest at 52 inches. The chart shows a wonderful response within the soil to the recent stretch of cold air temperatures with frost reaching the 20 inch sensor on Thursday. Even with air temperatures below 0 degrees Fahrenheit, it takes time for the soil to respond. Even with the on-going cooling, the effect of the slightly warmer weather on Wednesday can be seen with the "wave" of warming reaching 14 inches overnight into Thursday. Of course, these readings are within an agricultural field / soil. Frost depth can more quickly penetrate pavement road beds which are generally sand, rock and dry soils, which is why frost can reach depths where water lines lie and cause troubles.
Voting: Good - 21 Bad - 0
Generate This Chart on Website
Mon Jan 27, 2025

Omaha Snow Drought
27 Jan 2025 05:30 AM
A once in a lifetime winter storm brought heavy snowfall from eastern Texas to Florida last week. New Orleans reported a record snowfall of eight inches, which is a one day total exceeding many season to date totals over the Midwestern US. One such location is Omaha, Nebraska, with just an inch of snowfall total for the season! The featured chart presents the total snowfall between 1 September and 26 January for Omaha each year. The total this year is the lowest on record, with only two missing years of data since 1885! There is still plenty of time for snow to fall and many of the biggest snowfalls come late in the season as the storm systems have increased amounts of moisture to work with.
Voting: Good - 13 Bad - 0
Tags: snow
Generate This Chart on Website
Tue Jan 28, 2025

Low January Relative Humidities
28 Jan 2025 05:30 AM
Temperatures warmed very nicely on Monday with some locations in the state reaching 50°F. The lack of snowfall and dry air overhead allowed for afternoon relative humidity values to drop to extremely low values for January. For Des Moines, the afternoon relative humidity dipped to below 20% for a number of hours, which is extremely rare for January as shown by the featured chart. Based on available hourly observations, the chart presents the percentage of those hours during January with a relative humidity value below 20%. While it is hard to quality control those 1936 values, there was only a couple of days back in the early 2000s with such low values. Remarkably, fire weather concerns are present over the midwestern US with the snow drought, dry vegetation, and strong winds forecast this week.
Voting: Good - 11 Bad - 3
Generate This Chart on Website
Wed Jan 29, 2025
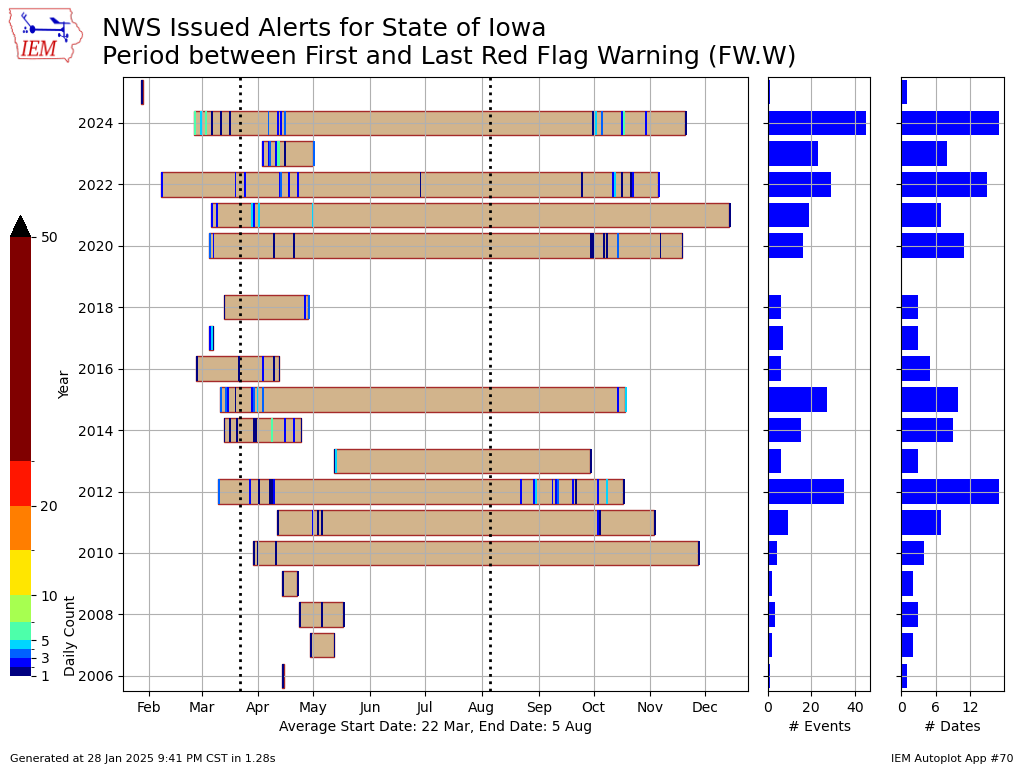
Early Red Flag Warning
29 Jan 2025 05:30 AM
NWS Sioux Falls issued a Red Flag Warning on Tuesday that covered a portion of NW Iowa. For Iowa, this was the first such warning issued during the month of January on record, but the archive only goes back 10 to 15 years. That caveat aside, it is still remarkable to see fire weather conditions materialize for the state during the middle of winter! The featured chart presents the period each year between the first and last such warning, with another caveat that not all Iowa serving NWS Offices have been issuing this warning type since 2006. Only 2022 has a comparably early instance with most years getting started during March.
Voting: Good - 14 Bad - 2
Generate This Chart on Website
Thu Jan 30, 2025
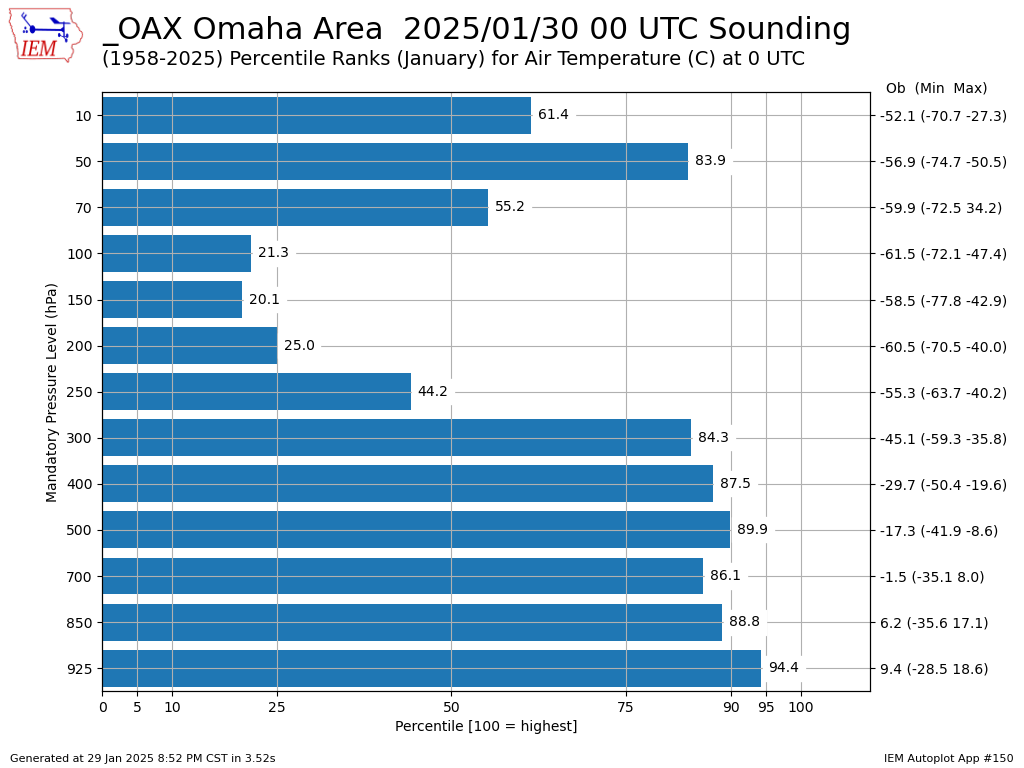
Warmth Above Us
30 Jan 2025 05:30 AM
Warmer temperatures this week have been a nice reprieve from our recent bout of winter cold. The warmth is not isolated to just where we live near the ground, but also extends above us into the lower atmosphere. The featured chart presents mandatory level temperature percentiles from Omaha for the Wednesday evening sounding. These percentiles are calculated over all January evening soundings from the site on record. A value of 100 would indicated the warmest on record. You can see warm percentiles extend to quite high levels, but then reverse around the 250 hPa level. The reason is that these levels are above the tropopause and while this gets difficult to explain, when the lower atmosphere is warmer than average, heights increase and these above tropopause levels are thus at higher altitudes than average, which will imply colder temperatures.
Voting: Good - 10 Bad - 2
Generate This Chart on Website
Fri Jan 31, 2025

More Snow in All Directions
31 Jan 2025 05:30 AM
The featured map presents a season to date total snowfall analysis from NOHRSC. The snowfall drought over Iowa this season is readily seen with higher season totals found in every direction travelling away from the state! Even more remarkable is to find higher snowfall totals in Louisiana and Florida than can be found in most of Iowa. Such as been the season to date with the most significant winter storms staying off to our south. There is still plenty of time for this pattern to flip, but the present storm today is just dumping needed rainfall and the near term forecast does not have much for snow chances.
Voting: Good - 17 Bad - 0
Tags: winter2425