The following tables present IEM computed monthly data summaries based on
daily data provided by or computed for the IEM. A download interface
exists for the daily summary information. The climatology is provided by the
nearest NCEI climate station () within the current 1991-2020
dataset.
To load shown data into Microsoft Excel,
highlight the table information with your mouse and then copy/paste into Excel.
Precipitation Totals [inch]
Year
Jan
Feb
Mar
Apr
May
Jun
Jul
Aug
Sep
Oct
Nov
Dec
2023
M
M
M
M
M
M
M
M
M
M
M
M
2024
M
M
M
M
M
M
M
M
M
M
M
M
2025
M
M
M
M
M
M
M
M
M
M
M
M
Average Wind Speed [MPH]
Year
Jan
Feb
Mar
Apr
May
Jun
Jul
Aug
Sep
Oct
Nov
Dec
2023
M
M
M
M
M
M
M
M
M
M
M
M
2024
M
M
M
M
M
M
M
M
M
M
M
M
2025
M
M
M
M
M
M
M
M
M
M
M
M
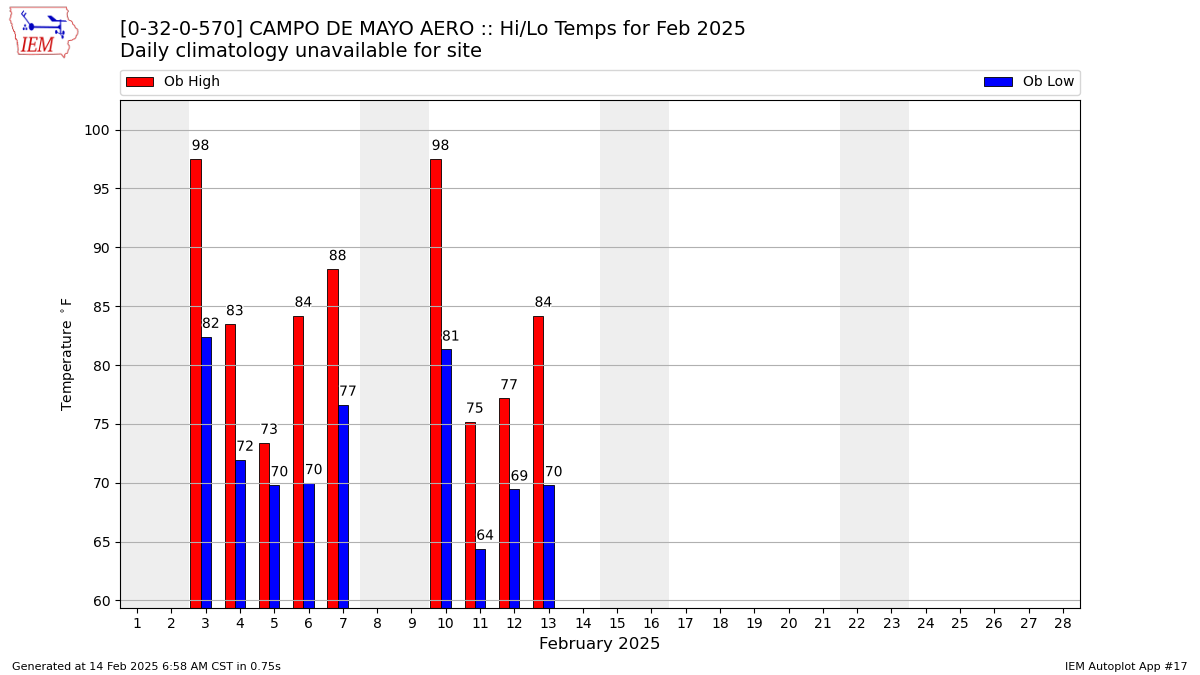
Average Daily High Temperature [F]
Year
Jan
Feb
Mar
Apr
May
Jun
Jul
Aug
Sep
Oct
Nov
Dec
2023
M
M
M
M
M
M
M
M
M
M
M
78.43
2024
81.57
82.42
77.92
69.52
58.73
62.10
57.20
59.53
69.85
74.71
78.02
79.61
2025
87.75
85.64
M
M
M
M
M
M
M
M
M
M
Average Daily Low Temperature [F]
Year
Jan
Feb
Mar
Apr
May
Jun
Jul
Aug
Sep
Oct
Nov
Dec
2023
M
M
M
M
M
M
M
M
M
M
M
65.44
2024
74.83
74.75
67.81
59.42
47.82
49.99
39.95
48.66
56.89
63.25
67.81
68.06
2025
75.47
73.79
M
M
M
M
M
M
M
M
M
M
Average Daily Temperature (high+low)/2 [F]
Year
Jan
Feb
Mar
Apr
May
Jun
Jul
Aug
Sep
Oct
Nov
Dec
2023
M
M
M
M
M
M
M
M
M
M
M
71.93
2024
78.20
78.58
72.86
64.47
53.27
56.05
48.57
54.10
63.37
68.98
72.92
73.84
2025
81.61
79.71
M
M
M
M
M
M
M
M
M
M
Average Relative Humidity [%]
This value is computed via a simple average of available observations weighted
by the duration between observations.