The following tables present IEM computed monthly data summaries based on
daily data provided by or computed for the IEM. A download interface
exists for the daily summary information. The climatology is provided by the
nearest NCEI climate station () within the current 1991-2020
dataset.
To load shown data into Microsoft Excel,
highlight the table information with your mouse and then copy/paste into Excel.
Precipitation Totals [inch]
Year
Jan
Feb
Mar
Apr
May
Jun
Jul
Aug
Sep
Oct
Nov
Dec
1973
0.00
0.00
0.00
0.00
0.00
0.00
0.00
0.00
0.00
0.00
0.00
0.00
1974
0.00
0.00
0.00
0.00
0.00
0.00
0.00
0.00
0.00
0.00
0.00
0.00
1975
0.00
0.00
0.00
0.00
0.00
0.00
0.00
0.00
0.00
0.00
0.00
0.00
1976
0.00
0.00
0.00
0.00
0.00
0.00
0.00
0.00
0.00
0.00
0.00
0.00
1977
0.00
0.00
0.00
0.00
0.00
0.00
0.00
0.00
0.00
0.00
0.00
0.00
1978
0.00
0.00
0.00
0.00
0.00
0.00
0.00
0.00
0.00
0.00
0.00
0.00
1979
0.00
0.00
0.00
0.00
0.00
0.00
0.00
0.00
0.00
0.00
0.00
0.00
1980
0.00
0.00
0.00
0.00
0.00
0.00
0.00
0.00
0.00
0.00
0.00
0.00
1981
0.00
0.00
0.00
0.00
0.00
0.00
0.00
0.00
0.00
0.00
0.00
0.00
1982
0.00
0.00
0.00
0.00
0.00
0.00
0.00
0.00
0.00
0.00
0.00
0.00
1983
0.00
0.00
0.00
0.00
0.00
0.00
0.00
0.00
0.00
0.00
0.00
0.00
1984
0.00
0.00
0.00
0.00
0.00
0.00
0.00
0.00
0.00
0.00
0.00
0.00
1985
0.00
0.00
0.00
0.00
0.00
0.00
0.00
0.00
0.00
0.00
0.00
0.00
1986
0.00
0.00
0.00
0.00
0.00
0.00
0.00
0.00
0.00
0.00
0.00
0.00
1987
0.00
0.00
0.00
0.00
0.00
0.00
0.00
0.00
0.00
0.00
0.00
0.00
1988
0.00
0.00
0.00
0.00
0.00
0.00
0.00
0.00
0.00
0.00
0.00
0.00
1989
0.00
0.00
0.00
0.00
0.00
0.00
0.00
0.00
0.00
0.00
0.00
0.00
1990
M
0.00
0.00
0.00
0.00
0.00
0.00
0.00
0.00
0.00
0.00
0.00
1991
0.00
0.00
0.00
0.00
0.00
0.00
0.00
0.00
0.00
0.00
0.00
0.00
1992
0.00
M
0.00
0.00
0.00
0.00
0.00
0.00
0.00
0.00
0.00
0.00
1993
0.00
0.00
0.00
0.00
0.00
0.00
0.00
0.00
0.00
0.00
0.00
0.00
1994
0.00
0.00
0.00
0.00
0.00
0.00
0.00
0.00
0.00
0.00
0.00
0.00
1995
0.00
0.00
0.00
0.00
0.00
0.00
0.00
0.00
0.00
0.00
0.00
0.00
1996
0.00
0.00
0.00
0.00
0.00
0.00
0.00
0.00
0.00
0.00
0.00
0.00
1997
0.00
0.00
0.00
0.00
0.00
0.00
0.00
0.00
0.00
M
M
M
1998
M
M
M
M
M
M
M
M
M
M
M
M
1999
M
M
M
M
M
0.00
0.00
0.00
0.00
0.00
0.00
0.00
2000
0.00
0.00
0.00
0.00
0.00
0.00
0.00
0.00
0.00
0.00
0.00
0.00
2001
0.00
0.00
0.00
M
0.00
0.00
0.00
0.00
M
0.00
0.00
0.00
2002
M
M
M
M
M
M
M
M
M
M
M
M
2003
M
M
M
M
M
0.00
M
M
M
M
M
M
2004
M
M
M
M
M
M
M
M
M
M
M
M
2005
M
M
M
M
0.00
M
M
M
M
M
M
M
2006
M
M
M
M
M
M
M
M
M
M
M
M
2007
M
M
M
M
M
M
M
M
M
M
M
M
2008
M
M
M
M
M
M
M
M
M
M
M
M
2009
0.00
0.00
0.00
0.00
M
M
M
M
M
M
M
M
2010
M
M
M
M
M
M
M
M
M
M
M
M
2011
M
M
M
M
M
M
M
0.00
0.00
0.00
0.00
0.00
2012
0.00
0.00
0.00
0.00
0.00
0.00
0.00
0.00
0.00
0.00
0.00
0.00
2013
0.00
0.00
0.00
0.00
0.00
0.00
0.00
0.00
0.00
M
M
M
2014
M
M
M
M
M
M
M
M
M
M
M
M
2015
M
M
M
M
M
M
M
M
M
M
M
M
2016
M
M
M
M
M
0.00
0.00
M
M
M
M
M
2017
M
M
M
M
M
M
0.00
M
M
M
M
M
2018
M
M
M
M
M
M
M
M
M
M
M
M
2019
M
M
M
M
M
M
M
M
M
M
M
M
2020
M
M
M
M
M
M
M
M
M
M
M
M
2021
M
M
M
M
M
M
M
M
M
M
M
M
2022
M
M
M
M
M
M
M
M
M
M
M
M
2023
M
M
M
M
M
M
M
M
M
M
M
M
2024
M
M
M
M
M
M
M
M
M
M
M
M
2025
M
M
M
M
M
M
M
M
M
M
M
M
Average Wind Speed [MPH]
Year
Jan
Feb
Mar
Apr
May
Jun
Jul
Aug
Sep
Oct
Nov
Dec
1973
6.1
4.8
4.5
3.8
4.8
4.5
5.5
5.7
6.2
5.6
5.8
5.9
1974
5.5
6.1
6.5
4.9
5.7
6.5
5.2
6.0
7.2
5.5
7.2
5.8
1975
5.1
5.7
5.0
4.3
3.7
4.5
5.5
6.8
6.6
6.3
6.8
5.9
1976
6.3
5.8
4.9
5.3
4.9
5.5
5.7
6.7
5.8
6.9
6.0
8.0
1977
7.9
10.0
9.5
8.9
7.2
7.2
9.6
9.3
9.0
8.0
6.7
7.4
1978
7.4
7.8
6.7
6.3
6.2
M
5.2
7.2
7.2
8.2
8.1
8.5
1979
6.7
6.8
6.8
7.4
3.7
4.6
3.4
M
M
M
M
5.1
1980
M
M
M
3.5
5.1
6.2
7.3
6.1
7.4
8.9
7.2
6.6
1981
6.3
6.2
5.2
5.6
5.7
6.8
6.3
7.1
8.6
7.5
8.1
6.9
1982
4.5
8.2
4.5
6.1
5.4
5.7
8.9
7.7
6.2
5.1
5.1
M
1983
M
7.6
7.7
7.4
5.0
6.2
8.3
9.2
8.6
M
6.2
7.8
1984
8.1
8.7
7.7
7.2
7.3
7.0
9.5
7.3
9.2
7.5
7.7
7.8
1985
6.3
6.1
6.9
6.8
5.7
4.3
8.9
8.4
8.7
6.7
8.0
7.7
1986
7.7
6.1
6.6
7.0
6.6
7.1
6.4
6.9
7.2
7.6
9.2
6.6
1987
6.1
7.7
6.6
6.3
6.4
6.1
7.9
6.4
6.9
10.1
7.7
M
1988
M
5.1
M
6.7
7.8
11.6
9.4
6.5
7.1
10.9
9.4
M
1989
6.8
5.6
7.3
9.4
7.6
M
5.6
M
6.0
7.4
6.6
M
1990
M
5.3
4.0
4.8
3.7
4.6
5.4
4.9
6.3
5.8
5.5
5.9
1991
4.8
5.2
4.9
4.9
4.1
4.8
5.1
5.4
5.4
7.2
5.7
6.4
1992
4.9
M
5.9
5.0
4.6
5.2
5.4
6.4
5.5
6.1
5.3
5.6
1993
5.0
5.3
4.1
3.4
4.1
4.5
5.4
5.4
6.5
7.2
7.0
5.5
1994
4.1
5.4
4.6
4.7
3.5
4.3
5.9
7.3
7.3
6.6
6.6
6.5
1995
5.7
3.4
5.1
5.1
4.8
5.5
6.7
6.1
7.0
6.1
5.9
5.8
1996
6.5
5.7
4.4
4.4
3.8
4.6
5.5
6.2
6.6
6.8
6.7
6.9
1997
6.6
7.7
5.4
6.1
6.2
6.0
6.7
7.4
8.3
M
M
M
1998
M
M
M
M
M
M
M
M
M
M
M
M
1999
M
M
M
M
M
7.0
7.5
7.6
8.5
7.9
7.7
7.4
2000
6.7
6.5
6.7
6.5
6.8
7.5
8.1
9.2
9.3
8.8
7.3
8.7
2001
8.0
5.7
11.8
M
7.0
8.9
8.2
6.9
M
9.0
M
10.0
2002
M
M
M
M
M
M
M
M
M
M
M
M
2003
M
M
M
M
M
10.1
M
M
M
M
M
M
2004
M
M
M
M
M
M
M
M
M
M
M
M
2005
M
M
M
M
4.4
M
M
M
M
M
M
M
2006
M
M
M
M
M
M
M
M
M
M
M
M
2007
M
M
M
M
M
6.3
7.7
8.1
8.4
8.1
8.0
6.8
2008
6.8
6.7
6.6
6.3
5.3
6.2
5.7
6.9
6.7
6.9
6.9
7.1
2009
7.5
7.5
6.8
6.3
6.8
7.1
8.1
8.6
8.6
8.7
8.5
7.2
2010
8.3
8.2
7.0
7.6
6.9
6.9
7.7
8.7
9.3
9.4
7.9
7.8
2011
7.8
8.1
6.5
6.4
6.0
6.2
6.7
7.5
8.4
7.6
6.9
7.0
2012
6.8
7.2
5.9
6.6
5.4
5.9
6.7
7.1
8.0
8.6
6.7
8.7
2013
5.9
6.4
6.7
6.0
6.0
5.9
6.9
7.6
8.1
7.4
7.5
6.9
2014
7.4
7.6
6.7
6.9
6.6
6.7
5.9
7.7
9.5
8.9
8.7
8.6
2015
7.5
7.1
6.3
6.9
6.5
7.3
7.9
8.0
8.6
9.6
7.4
8.4
2016
7.5
8.7
7.3
6.9
7.4
6.3
8.5
9.2
8.7
9.4
9.2
8.3
2017
8.3
9.7
7.6
6.9
7.0
7.2
6.7
7.8
9.1
8.6
8.4
7.6
2018
7.9
7.2
6.9
6.1
6.4
6.5
7.1
7.2
7.7
7.5
8.4
7.5
2019
8.1
7.3
6.7
6.4
5.6
6.0
7.7
8.2
8.1
8.4
7.9
8.1
2020
7.3
7.2
6.2
5.9
6.5
6.6
7.1
7.5
8.2
7.9
7.4
7.0
2021
7.8
6.7
6.7
6.6
5.6
6.5
6.7
7.2
8.0
7.0
7.0
7.4
2022
6.8
6.1
7.3
6.4
6.4
6.5
7.0
7.7
7.4
7.6
7.3
7.3
2023
6.7
6.8
6.3
5.8
5.5
6.1
6.8
7.3
8.2
7.6
7.6
7.2
2024
7.1
6.9
6.5
6.0
6.7
6.9
6.1
7.6
7.9
7.9
7.3
7.5
2025
6.4
7.3
7.5
M
M
M
M
M
M
M
M
M
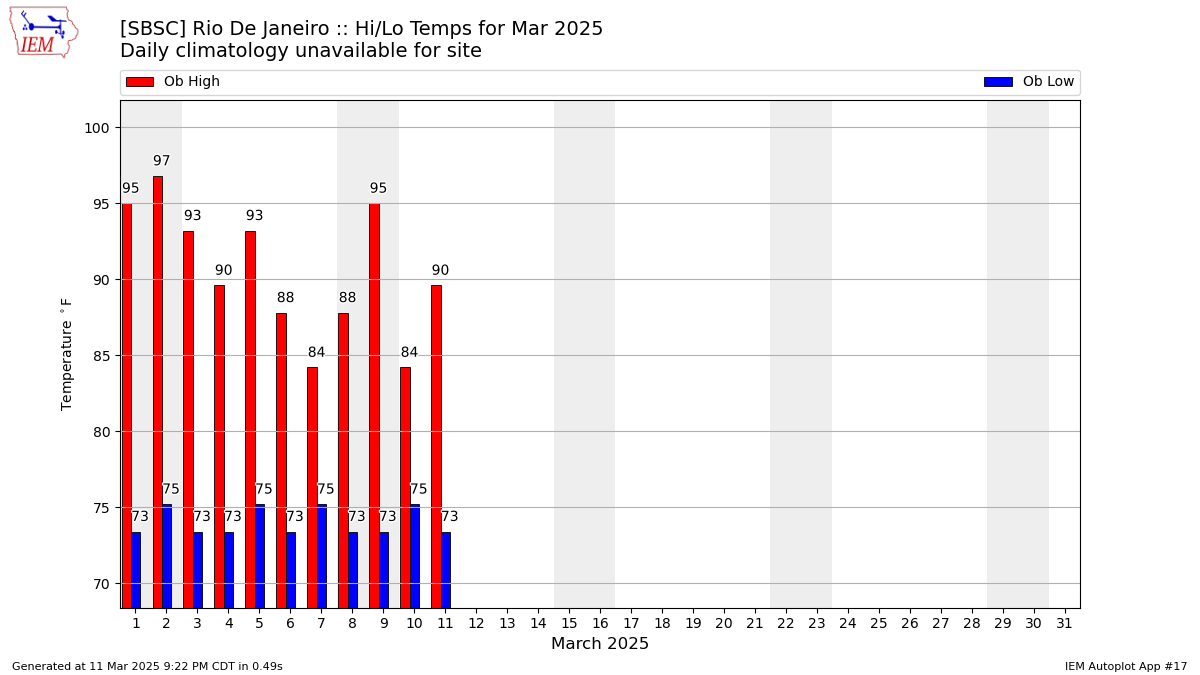
Average Daily High Temperature [F]
Year
Jan
Feb
Mar
Apr
May
Jun
Jul
Aug
Sep
Oct
Nov
Dec
1973
90.26
92.15
84.68
87.00
80.58
81.10
80.87
77.48
78.70
79.00
80.34
86.30
1974
89.06
89.39
87.23
81.93
80.87
76.60
80.94
81.55
80.70
79.94
84.97
83.81
1975
85.77
89.11
88.84
82.53
78.33
76.83
75.85
83.26
80.83
78.42
82.93
88.32
1976
91.29
87.34
87.00
84.80
78.87
78.30
76.45
78.29
77.77
80.45
83.17
84.68
1977
87.43
93.96
89.30
83.32
81.41
80.10
86.37
79.54
80.50
80.93
83.38
81.58
1978
88.61
86.12
86.57
79.70
80.12
81.00
79.46
79.67
79.52
80.94
83.68
85.06
1979
81.23
82.22
83.90
80.00
77.47
77.15
74.65
81.58
78.70
82.86
81.20
84.76
1980
83.64
88.21
94.25
83.31
83.28
79.57
78.80
78.32
77.67
78.06
80.86
87.17
1981
87.27
90.18
84.67
83.00
80.86
77.57
75.41
78.31
81.79
76.12
81.83
84.22
1982
80.50
90.00
82.68
79.75
78.26
80.12
78.96
80.33
78.05
79.92
82.90
78.83
1983
86.78
93.30
86.40
83.17
82.00
78.19
77.12
76.59
71.61
75.12
80.64
84.94
1984
91.17
90.96
84.21
80.93
84.31
81.97
80.85
76.76
77.79
81.39
81.31
83.54
1985
81.89
89.05
86.56
85.19
78.50
78.04
78.44
81.10
75.85
79.65
81.79
84.00
1986
89.00
88.96
86.28
85.80
84.65
80.00
75.77
78.93
78.30
80.73
85.68
84.11
1987
87.50
89.81
83.84
85.17
79.13
80.06
82.36
78.75
74.86
77.40
81.67
87.00
1988
88.67
85.38
87.33
88.00
78.90
71.89
74.81
75.89
79.50
80.33
78.26
83.31
1989
88.16
87.67
85.95
85.31
79.55
72.50
77.56
77.00
77.31
77.30
81.20
72.00
1990
M
88.82
88.97
88.90
82.26
79.80
77.03
77.42
79.53
84.84
87.83
87.94
1991
86.13
88.14
86.48
85.87
81.68
81.37
77.80
79.68
76.83
82.39
82.63
89.45
1992
85.12
M
89.74
83.44
81.42
82.07
78.23
77.29
78.73
84.00
81.03
84.68
1993
90.97
91.11
89.61
87.77
81.90
78.57
79.58
77.58
77.30
86.11
88.08
87.68
1994
86.06
95.11
85.58
82.79
84.39
80.47
80.94
78.42
82.40
84.06
85.67
89.32
1995
91.48
88.71
87.74
83.73
79.94
80.93
82.19
84.19
82.10
78.65
84.70
85.90
1996
92.00
92.38
88.00
87.60
80.42
79.13
74.26
78.26
78.97
84.03
83.90
89.74
1997
89.23
94.43
86.81
85.28
82.65
81.27
83.74
82.55
83.47
M
M
M
1998
M
M
M
M
M
M
M
M
M
M
M
M
1999
M
M
M
M
M
81.29
78.16
78.77
83.24
77.55
80.52
85.23
2000
88.61
88.79
86.52
86.17
82.29
81.30
75.97
79.79
78.07
83.04
81.06
82.29
2001
92.43
87.00
84.00
M
82.71
78.82
78.53
79.00
M
78.00
80.00
84.00
2002
M
M
M
M
M
M
M
M
M
M
M
M
2003
M
95.00
M
M
M
80.97
M
M
M
M
M
77.00
2004
M
M
M
M
M
M
M
M
M
M
M
M
2005
M
M
M
M
77.00
M
M
M
M
M
M
M
2006
M
M
M
M
M
M
M
M
M
M
M
M
2007
M
M
M
M
M
M
M
M
M
M
M
M
2008
M
M
M
M
M
M
M
M
M
M
M
M
2009
91.67
89.71
88.18
81.68
M
M
M
M
M
M
86.00
M
2010
86.00
M
M
M
77.00
M
M
77.90
M
M
72.50
86.23
2011
92.96
M
M
84.20
63.50
65.00
62.60
82.22
78.44
80.95
80.00
84.14
2012
85.59
91.03
86.58
84.08
79.32
78.86
78.50
80.14
80.24
83.56
80.18
84.38
2013
83.37
89.99
84.72
81.38
79.26
79.82
76.88
79.32
82.28
80.72
83.42
85.88
2014
94.54
94.74
88.96
83.54
81.01
80.84
77.29
79.73
84.02
84.37
85.10
88.85
2015
91.81
89.34
85.48
83.06
80.14
80.12
80.31
84.55
81.14
82.92
83.27
88.46
2016
85.36
91.21
89.25
87.71
80.19
74.18
79.79
81.99
80.00
82.81
83.30
88.50
2017
91.40
92.17
86.64
82.88
80.25
79.88
78.74
78.86
85.52
85.59
84.08
85.83
2018
89.66
87.35
88.73
86.12
81.06
80.81
82.52
78.68
82.82
82.17
85.16
89.37
2019
95.93
90.11
88.90
87.98
84.61
83.54
80.77
80.43
81.14
85.65
82.46
86.35
2020
88.32
86.68
84.20
82.40
80.66
83.30
81.76
81.18
85.70
82.85
82.04
86.06
2021
93.08
87.67
89.54
82.34
80.54
78.20
77.17
80.77
83.00
79.38
81.08
83.85
2022
88.09
87.54
91.81
84.14
81.35
76.64
83.85
79.67
77.42
82.81
80.96
84.03
2023
87.16
91.40
89.43
82.94
81.06
80.90
80.43
82.46
87.80
83.56
88.70
88.32
2024
87.92
89.23
86.87
87.14
86.87
85.82
78.57
83.33
86.30
82.92
85.04
86.58
2025
88.15
95.45
90.25
M
M
M
M
M
M
M
M
M
Average Daily Low Temperature [F]
Year
Jan
Feb
Mar
Apr
May
Jun
Jul
Aug
Sep
Oct
Nov
Dec
1973
73.29
73.11
70.97
72.10
64.84
63.73
63.84
62.65
64.07
64.42
65.76
72.40
1974
71.77
71.96
72.29
67.47
63.94
61.63
59.39
61.13
65.30
66.61
67.30
69.35
1975
69.96
72.75
70.84
64.03
62.47
60.67
56.67
64.16
64.50
66.61
68.13
71.16
1976
72.32
70.90
70.65
68.97
64.90
61.67
60.29
62.61
65.93
66.52
71.10
73.26
1977
74.50
75.44
75.93
72.80
67.97
67.83
70.13
68.96
67.57
69.33
71.57
70.16
1978
74.26
72.62
72.27
67.37
65.59
66.00
64.71
63.11
66.31
67.87
71.46
72.35
1979
70.07
73.61
72.95
69.20
66.41
61.38
61.35
67.00
65.40
70.57
70.40
73.94
1980
73.82
73.14
74.17
68.75
67.60
63.43
64.96
65.60
65.25
67.25
69.62
73.06
1981
74.77
73.71
73.27
69.24
65.89
62.33
60.14
63.19
66.45
66.38
69.52
72.00
1982
71.56
73.88
73.36
68.54
64.78
67.16
64.24
65.71
66.20
69.85
74.95
71.17
1983
76.33
78.20
74.50
71.11
70.43
66.38
64.85
63.10
64.78
69.62
70.09
73.71
1984
75.27
77.11
73.72
71.61
71.14
68.03
67.30
65.28
65.42
70.71
72.21
73.75
1985
73.59
76.65
75.19
72.73
67.31
63.84
63.20
66.00
65.96
68.94
71.17
71.87
1986
75.52
76.12
75.44
72.57
70.58
63.63
61.39
66.55
65.00
67.67
72.50
74.00
1987
76.11
76.44
72.42
73.66
68.81
65.94
67.91
64.64
66.07
68.73
71.28
76.00
1988
78.00
75.88
77.33
74.67
70.20
65.89
63.44
64.83
67.21
71.17
70.74
75.19
1989
76.89
77.00
76.60
74.19
66.50
68.00
65.33
67.33
67.08
69.45
68.20
71.00
1990
M
73.09
73.27
72.70
65.16
61.57
62.06
61.90
64.40
69.68
72.57
72.87
1991
72.32
73.89
72.13
70.27
66.19
66.03
62.10
61.58
61.83
66.84
68.67
72.61
1992
73.06
M
72.16
68.37
66.90
65.28
63.39
64.03
65.50
68.00
68.53
70.03
1993
73.97
73.39
73.19
71.77
67.19
62.10
63.58
62.32
64.63
68.07
71.12
71.55
1994
71.58
75.50
71.55
69.11
69.19
63.67
63.77
62.71
64.10
68.23
70.00
73.58
1995
75.23
74.11
72.19
68.57
66.26
62.20
65.10
65.84
64.33
66.13
69.33
71.94
1996
75.90
76.07
74.81
71.57
66.35
65.10
61.48
62.16
64.67
66.97
69.57
73.45
1997
74.07
75.43
73.52
70.79
67.03
65.93
65.74
65.84
66.37
M
M
M
1998
M
M
M
M
M
M
M
M
M
M
M
M
1999
M
M
M
M
M
66.71
67.39
64.71
68.83
67.66
68.41
72.52
2000
76.06
75.90
73.48
72.17
66.32
64.03
60.48
61.83
65.47
71.37
71.22
71.14
2001
77.57
76.12
73.00
M
70.57
68.82
64.94
66.44
M
68.00
71.00
79.00
2002
M
M
M
M
M
M
M
M
M
M
M
M
2003
M
95.00
M
M
M
75.77
M
M
M
M
M
77.00
2004
M
M
M
M
M
M
M
M
M
M
M
M
2005
M
M
M
M
66.00
M
M
M
M
M
M
M
2006
M
M
M
M
M
M
M
M
M
M
M
M
2007
M
M
M
M
M
M
M
M
M
M
M
M
2008
M
M
M
M
M
M
M
M
M
M
M
M
2009
73.17
74.02
72.82
70.08
M
M
M
M
M
M
86.00
M
2010
86.00
M
M
M
77.00
M
M
77.90
M
M
72.50
73.23
2011
75.32
M
M
80.60
61.70
60.20
62.60
63.50
62.12
63.99
65.30
69.97
2012
70.15
72.41
70.90
70.10
62.83
65.48
61.82
62.08
64.40
68.41
68.66
72.68
2013
70.48
73.21
71.37
66.56
62.89
63.92
59.12
60.74
63.80
64.63
68.00
70.96
2014
74.50
73.53
72.88
68.84
64.34
65.18
63.24
62.95
66.14
67.01
70.46
72.24
2015
74.85
73.40
72.12
69.08
65.27
62.66
64.28
63.65
66.80
68.81
71.48
72.62
2016
72.30
73.65
74.15
72.03
66.20
62.42
63.94
63.94
67.16
69.51
70.16
73.28
2017
75.66
75.65
72.88
69.74
65.91
63.92
60.51
62.37
64.94
69.34
69.20
71.83
2018
73.75
72.56
74.33
69.26
63.18
62.28
63.99
63.82
67.28
69.39
70.82
72.70
2019
76.36
73.85
73.34
70.52
68.12
64.64
60.86
62.25
66.62
69.22
69.86
71.43
2020
72.70
72.34
70.44
68.24
62.48
65.24
63.65
62.14
68.72
67.49
68.72
72.65
2021
74.15
71.86
72.30
66.56
63.88
63.74
58.13
62.83
67.40
66.08
66.02
69.86
2022
73.17
72.24
72.99
69.26
64.57
61.70
63.47
62.08
62.48
68.35
67.40
70.50
2023
72.12
73.40
72.47
68.78
64.98
62.18
62.31
66.08
68.84
69.97
71.60
73.11
2024
73.23
74.39
73.52
70.52
69.68
65.00
62.83
61.38
67.40
68.64
70.10
72.18
2025
72.99
74.69
74.05
M
M
M
M
M
M
M
M
M
Average Daily Temperature (high+low)/2 [F]
Year
Jan
Feb
Mar
Apr
May
Jun
Jul
Aug
Sep
Oct
Nov
Dec
1973
81.77
82.63
77.82
79.55
72.71
72.42
72.35
70.06
71.38
71.71
73.05
79.35
1974
80.42
80.68
79.76
74.70
72.40
69.12
70.16
71.34
73.00
73.27
76.13
76.58
1975
77.87
80.93
79.84
73.28
70.40
68.75
66.26
73.71
72.67
72.52
75.53
79.74
1976
81.81
79.12
78.82
76.88
71.89
69.98
68.37
70.45
71.85
73.48
77.13
78.97
1977
80.96
84.70
82.61
78.06
74.69
73.97
78.25
74.25
74.03
75.13
77.48
75.87
1978
81.44
79.37
79.42
73.54
72.85
73.50
72.08
71.39
72.91
74.40
77.57
78.71
1979
75.65
77.92
78.43
74.60
71.94
69.27
68.00
74.29
72.05
76.71
75.80
79.35
1980
78.73
80.68
84.21
76.03
75.44
71.50
71.88
71.96
71.46
72.66
75.24
80.11
1981
81.02
81.95
78.97
76.12
73.38
69.95
67.78
70.75
74.12
71.25
75.67
78.11
1982
76.03
81.94
78.02
74.14
71.52
73.64
71.60
73.02
72.12
74.88
78.92
75.00
1983
81.56
85.75
80.45
77.14
76.21
72.28
70.98
69.84
68.19
72.38
75.36
79.32
1984
83.22
84.04
78.97
76.27
77.72
75.00
74.07
71.02
71.60
76.05
76.76
78.64
1985
77.74
82.85
80.87
78.96
72.90
70.94
70.82
73.55
70.90
74.29
76.48
77.93
1986
82.26
82.54
80.86
79.18
77.61
71.82
68.58
72.74
71.65
74.20
79.09
79.05
1987
81.81
83.13
78.13
79.41
73.97
73.00
75.14
71.70
70.46
73.07
76.47
81.50
1988
83.33
80.62
82.33
81.33
74.55
68.89
69.12
70.36
73.36
75.75
74.50
79.25
1989
82.53
82.33
81.28
79.75
73.03
70.25
71.44
72.17
72.19
73.38
74.70
71.50
1990
M
80.95
81.12
80.80
73.71
70.68
69.55
69.66
71.97
77.26
80.20
80.40
1991
79.23
81.02
79.31
78.07
73.94
73.70
69.95
70.63
69.33
74.61
75.65
81.03
1992
79.09
M
80.95
75.91
74.16
73.67
70.81
70.66
72.12
76.00
74.78
77.35
1993
82.47
82.25
81.40
79.77
74.55
70.33
71.58
69.95
70.97
77.09
79.60
79.61
1994
78.82
85.30
78.56
75.95
76.79
72.07
72.35
70.56
73.25
76.15
77.83
81.45
1995
83.35
81.41
79.97
76.15
73.10
71.57
73.65
75.02
73.22
72.39
77.02
78.92
1996
83.95
84.22
81.40
79.58
73.39
72.12
67.87
70.21
71.82
75.50
76.73
81.60
1997
81.65
84.93
80.16
78.03
74.84
73.60
74.74
74.19
74.92
M
M
M
1998
M
M
M
M
M
M
M
M
M
M
M
M
1999
M
M
M
M
M
74.00
72.77
71.74
76.03
72.60
74.47
78.87
2000
82.34
82.34
80.00
79.17
74.31
72.67
68.23
70.81
71.77
77.20
76.14
76.71
2001
85.00
81.56
78.50
M
76.64
73.82
71.74
72.72
M
73.00
75.50
81.50
2002
M
M
M
M
M
M
M
M
M
M
M
M
2003
M
95.00
M
M
M
78.37
M
M
M
M
M
77.00
2004
M
M
M
M
M
M
M
M
M
M
M
M
2005
M
M
M
M
71.50
M
M
M
M
M
M
M
2006
M
M
M
M
M
M
M
M
M
M
M
M
2007
M
M
M
M
M
M
M
M
M
M
M
M
2008
M
M
M
M
M
M
M
M
M
M
M
M
2009
82.42
81.86
80.50
75.88
M
M
M
M
M
M
86.00
M
2010
86.00
M
M
M
77.00
M
M
77.90
M
M
72.50
79.73
2011
84.14
M
M
82.40
62.60
62.60
62.60
72.86
70.28
72.47
72.65
77.06
2012
77.87
81.72
78.74
77.09
71.08
72.17
70.16
71.11
72.32
75.98
74.42
78.53
2013
76.93
81.60
78.05
73.97
71.08
71.87
68.00
70.03
73.04
72.67
75.71
78.42
2014
84.52
84.14
80.92
76.19
72.67
73.01
70.26
71.34
75.08
75.69
77.78
80.54
2015
83.33
81.37
78.80
76.07
72.70
71.39
72.30
74.10
73.97
75.87
77.37
80.54
2016
78.83
82.43
81.70
79.87
73.20
68.30
71.86
72.96
73.58
76.16
76.73
80.89
2017
83.53
83.91
79.76
76.31
73.08
71.90
69.63
70.61
75.23
77.46
76.64
78.83
2018
81.70
79.96
81.53
77.69
72.12
71.55
73.25
71.25
75.05
75.78
77.99
81.04
2019
86.15
81.98
81.12
79.25
76.36
74.09
70.82
71.34
73.88
77.44
76.16
78.89
2020
80.51
79.51
77.32
75.32
71.57
74.27
72.70
71.66
77.21
75.17
75.38
79.35
2021
83.62
79.76
80.92
74.45
72.21
70.97
67.65
71.80
75.20
72.73
73.55
76.85
2022
80.63
79.89
82.40
76.70
72.96
69.17
73.66
70.87
69.95
75.58
74.18
77.26
2023
79.64
82.40
80.95
75.86
73.02
71.54
71.37
74.27
78.32
76.77
80.15
80.72
2024
80.57
81.81
80.19
78.83
78.28
75.41
70.70
72.35
76.85
75.78
77.57
79.38
2025
80.57
85.07
82.15
M
M
M
M
M
M
M
M
M
Average Relative Humidity [%]
This value is computed via a simple average of available observations weighted
by the duration between observations.