Information Last Ob Photographs Meteogram Network Table Neighbors Monthly Summaries Observation History Wind Roses Custom Wind Roses Data Calendar
| Jan 2025 | Feb 2025 | Mar 2025 | ||||
|---|---|---|---|---|---|---|
| Sunday | Monday | Tuesday | Wednesday | Thursday | Friday | Saturday |
| 26 | 27 | 28 | 29 | 30 | 31 | 01 High: 21.290022 Low: 15.499403 Precip: M Gust: 19 (2:40 AM) RH% Min/Max: 90-95 Feel Min/Max: 5 to 13 |
| 02 High: 27.179573 Low: 21.129786 Precip: M Gust: 17 (2:20 AM) RH% Min/Max: 57-98 Feel Min/Max: 11 to 19 | 03 High: 30.520405 Low: 23.68938 Precip: M Gust: 15 (6:50 PM) RH% Min/Max: 46-78 Feel Min/Max: 16 to 25 | 04 High: 29.5808 Low: 23.500416 Precip: M Gust: 19 (10:30 PM) RH% Min/Max: 48-98 Feel Min/Max: 14 to 24 | 05 High: 24.08 Low: 15.169978 Precip: M Gust: 21 (12:50 AM) RH% Min/Max: 60-94 Feel Min/Max: 6 to 15 | 06 High: 27.100416 Low: 15.130372 Precip: M Gust: 19 (2:40 PM) RH% Min/Max: 38-94 Feel Min/Max: 5 to 19 | 07 High: 21.950575 Low: 4.240394 Precip: M Gust: 21 (11:00 AM) RH% Min/Max: 84-96 Feel Min/Max: -6 to 11 | 08 High: 10.160597 Low: -1.8597919 Precip: M Gust: 15 (7:00 PM) RH% Min/Max: 71-85 Feel Min/Max: -14 to 4 |
| 09 High: 11.060596 Low: -4.6696 Precip: M Gust: 12 (12:40 AM) RH% Min/Max: 38-77 Feel Min/Max: -17 to 11 | 10 High: 12.070405 Low: -2.4105914 Precip: M Gust: 9 (4:40 AM) RH% Min/Max: 37-81 Feel Min/Max: -10 to 11 | 11 High: 7.0807996 Low: -14.130394 Precip: M Gust: 17 (11:30 PM) RH% Min/Max: 62-78 Feel Min/Max: -33 to 4 | 12 High: -3.6706133 Low: -16.859205 Precip: M Gust: 17 (4:20 PM) RH% Min/Max: 30-73 Feel Min/Max: -33 to -6 | 13 High: 13.099989 Low: -5.6001973 Precip: M Gust: 12 (4:00 AM) RH% Min/Max: 26-89 Feel Min/Max: -16 to 5 | 14 High: 19.279413 Low: 11.240608 Precip: M Gust: 16 (3:10 AM) RH% Min/Max: 80-91 Feel Min/Max: 0 to 17 | 15 High: 13.290821 Low: 1.250575 Precip: M Gust: 20 (10:20 PM) RH% Min/Max: 56-90 Feel Min/Max: -13 to 13 |
| 16 High: 18.84919 Low: 3.8893812 Precip: M Gust: 19 (3:40 AM) RH% Min/Max: 75-92 Feel Min/Max: -10 to 14 | 17 High: 17.200417 Low: 9.6097975 Precip: M Gust: 18 (4:40 AM) RH% Min/Max: 66-91 Feel Min/Max: -3 to 10 | 18 High: 13.139595 Low: 5.390608 Precip: M Gust: 16 (7:40 AM) RH% Min/Max: 67-86 Feel Min/Max: -7 to 13 | 19 High: 22.789381 Low: 5.5004163 Precip: M Gust: 19 (3:40 AM) RH% Min/Max: 12-92 Feel Min/Max: -7 to 21 | 20 High: 16.3292 Low: 9.68 Precip: M Gust: 15 (10:40 PM) RH% Min/Max: 78-91 Feel Min/Max: -3 to 16 | 21 High: 24.740608 Low: 8.479414 Precip: M Gust: 13 (3:40 AM) RH% Min/Max: 7-87 Feel Min/Max: -3 to 25 | 22 High: 26.920404 Low: 16.660383 Precip: M Gust: 22 (7:20 PM) RH% Min/Max: 3-71 Feel Min/Max: 7 to 24 |
| 23 High: 29.3792 Low: 17.889809 Precip: M Gust: 17 (1:50 AM) RH% Min/Max: 38-95 Feel Min/Max: 11 to 28 | 24 High: 31.33938 Low: 21.649988 Precip: M Gust: 16 (8:10 AM) RH% Min/Max: 26-94 Feel Min/Max: 12 to 26 | 25 Precip: M | 26 | 27 | 28 | 01 |
The data presented here provided by IEM API webservice: daily.json. A simple CSV option exists as well.
Daily High/Low Plot

Description: This chart of the monthly temperature data. The bars are the observations and the dots are climatology.
Daily Rainfall
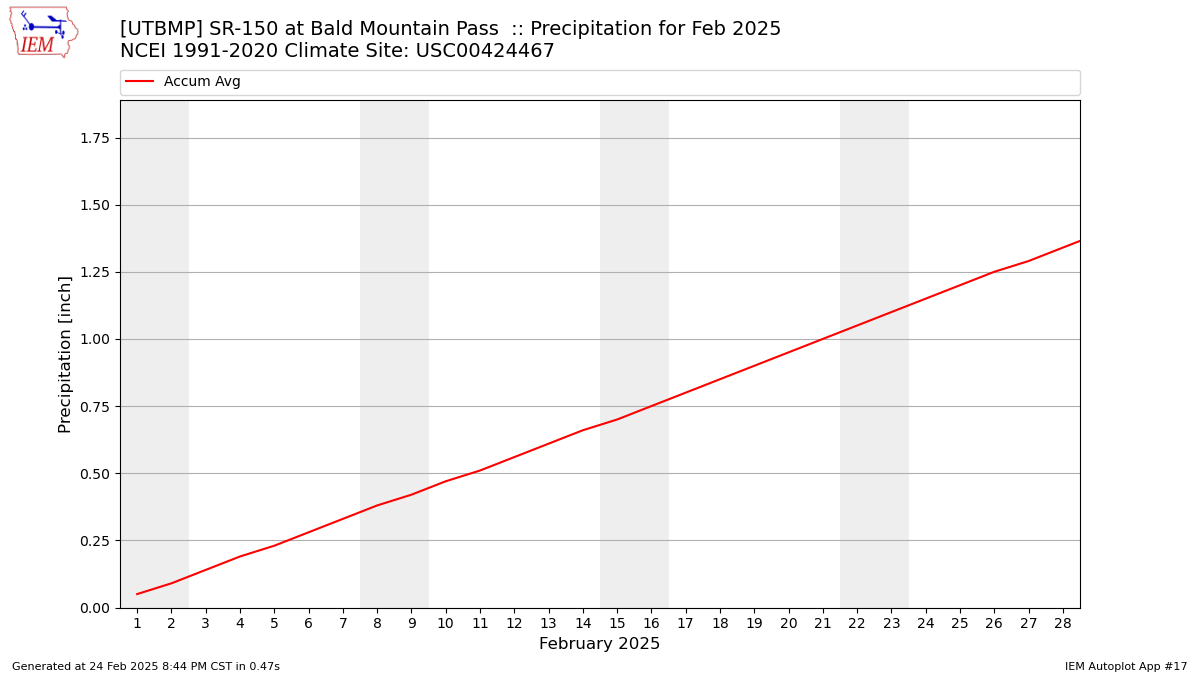
Description: This chart is of daily precipitation for the month. The red line would be an average month while the blue line and bars are observations.
Daily Average Wind Speeds
Description: This chart is of the daily average wind speeds.
The data presented here provided by IEM API webservice: daily.json. A simple CSV option exists as well.