Information Last Ob Photographs Meteogram Network Table Neighbors Monthly Summaries Observation History Data Calendar
| Jan 2025 | Feb 2025 | Mar 2025 | ||||
|---|---|---|---|---|---|---|
| Sunday | Monday | Tuesday | Wednesday | Thursday | Friday | Saturday |
| 26 | 27 | 28 | 29 | 30 | 31 | 01 Precip: M |
| 02 Precip: M | 03 Precip: M | 04 Precip: M | 05 Precip: M | 06 Precip: M | 07 Precip: M | 08 Precip: M |
| 09 Precip: M | 10 Precip: M | 11 Precip: M | 12 Precip: M | 13 Precip: M | 14 Precip: M | 15 Precip: M |
| 16 Precip: M | 17 Precip: M | 18 Precip: M | 19 Precip: M | 20 | 21 | 22 |
| 23 | 24 | 25 | 26 | 27 | 28 | 01 |
The data presented here provided by IEM API webservice: daily.json. A simple CSV option exists as well.
Daily High/Low Plot
Description: This chart of the monthly temperature data. The bars are the observations and the dots are climatology.
Daily Rainfall
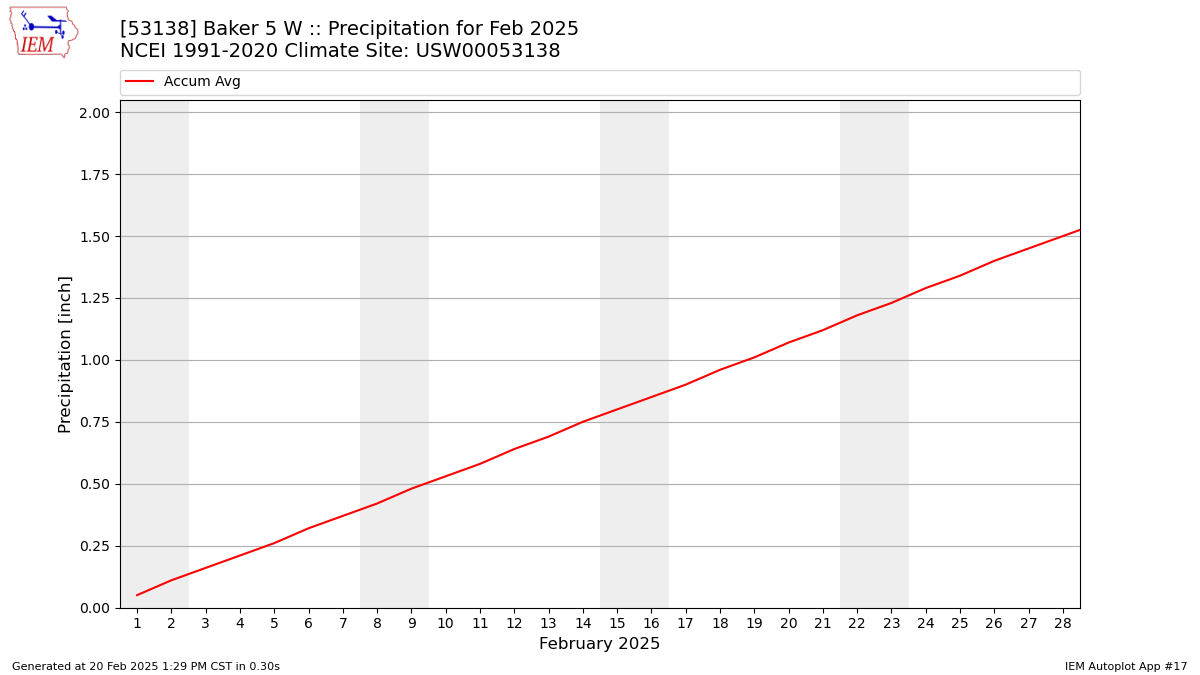
Description: This chart is of daily precipitation for the month. The red line would be an average month while the blue line and bars are observations.
Daily Average Wind Speeds
Description: This chart is of the daily average wind speeds.
The data presented here provided by IEM API webservice: daily.json. A simple CSV option exists as well.