Information Last Ob Photographs Meteogram Network Table Neighbors Monthly Summaries Observation History Wind Roses Custom Wind Roses Data Calendar Download
| Mar 2025 | Apr 2025 | May 2025 | ||||
|---|---|---|---|---|---|---|
| Sunday | Monday | Tuesday | Wednesday | Thursday | Friday | Saturday |
| 30 | 31 | 01 Precip: M RH% Min/Max: 368-368 | 02 Precip: M | 03 Precip: M RH% Min/Max: 235-235 | 04 Precip: M | 05 Precip: M RH% Min/Max: 76-76 |
| 06 High: 173.45 Low: 173.45 Precip: M RH% Min/Max: 259-259 | 07 Precip: M | 08 High: 399.66 Low: 90.71 Precip: M | 09 Precip: M | 10 High: 46.26 Low: 46.26 Precip: M RH% Min/Max: 470-470 | 11 High: 721.81 Low: 13.25 Precip: M | 12 High: 764.94 Low: 153.64 Precip: M |
| 13 High: 258.39 Low: 258.39 Precip: M RH% Min/Max: 421-421 | 14 High: 246.95 Low: 246.95 Precip: M RH% Min/Max: 152-152 | 15 High: 421.22 Low: 187.53 Precip: M RH% Min/Max: 221-434 | 16 Precip: M | 17 High: 658 Low: 98.19 Precip: M RH% Min/Max: 122-122 | 18 Precip: M RH% Min/Max: 205-205 | 19 High: 240.78 Low: 240.78 Precip: M RH% Min/Max: 57-57 |
| 20 High: 769.34 Low: 769.34 Precip: M | 21 Precip: M RH% Min/Max: 254-370 | 22 High: 811.15 Low: 811.15 Precip: M RH% Min/Max: 293-293 | 23 Precip: M RH% Min/Max: 300-300 | 24 High: 256.63 Low: 256.63 Precip: M RH% Min/Max: 58-58 | 25 Precip: M | 26 |
| 27 | 28 | 29 | 30 | 01 | 02 | 03 |
The data presented here provided by IEM API webservice: daily.json. A simple CSV option exists as well.
Daily High/Low Plot

Description: This chart of the monthly temperature data. The bars are the observations and the dots are climatology.
Daily Rainfall
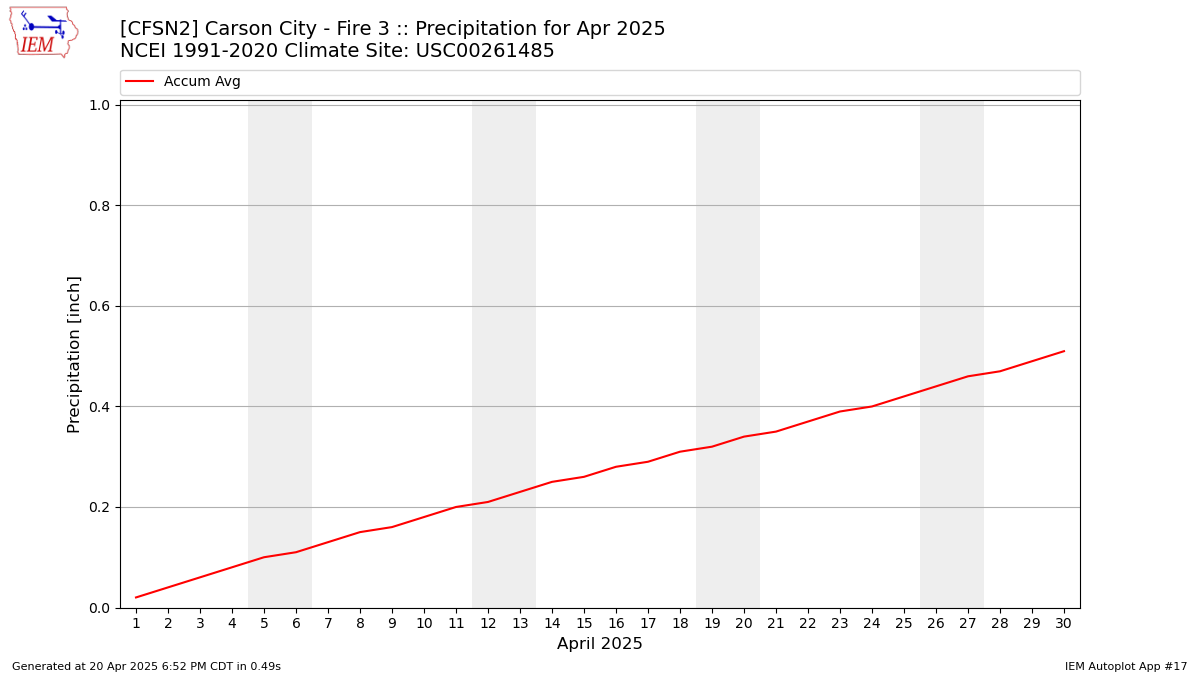
Description: This chart is of daily precipitation for the month. The red line would be an average month while the blue line and bars are observations.
Daily Average Wind Speeds

Description: This chart is of the daily average wind speeds.
The data presented here provided by IEM API webservice: daily.json. A simple CSV option exists as well.