Information Last Ob Photographs Meteogram Network Table Neighbors Monthly Summaries Observation History Wind Roses Custom Wind Roses Data Calendar
| Feb 2025 | Mar 2025 | Apr 2025 | ||||
|---|---|---|---|---|---|---|
| Sunday | Monday | Tuesday | Wednesday | Thursday | Friday | Saturday |
| 23 | 24 | 25 | 26 | 27 | 28 | 01 High: 28.219978 Low: 10.9400215 Precip: 0.00 Avg Wind: SSE @ 8.2 Gust: 17 (3:15 PM) RH% Min/Max: 60-80 Feel Min/Max: -0 to 20 |
| 02 High: 50.360012 Low: 18.86001 Precip: 0.00 Gust: 17 (12:35 PM) RH% Min/Max: 46-73 Feel Min/Max: 10 to 50 | 03 Precip: M | 04 | 05 | 06 | 07 | 08 |
| 09 | 10 | 11 | 12 | 13 | 14 | 15 |
| 16 | 17 | 18 | 19 | 20 | 21 | 22 |
| 23 | 24 | 25 | 26 | 27 | 28 | 29 |
| 30 | 31 | 01 | 02 | 03 | 04 | 05 |
The data presented here provided by IEM API webservice: daily.json. A simple CSV option exists as well.
Daily High/Low Plot
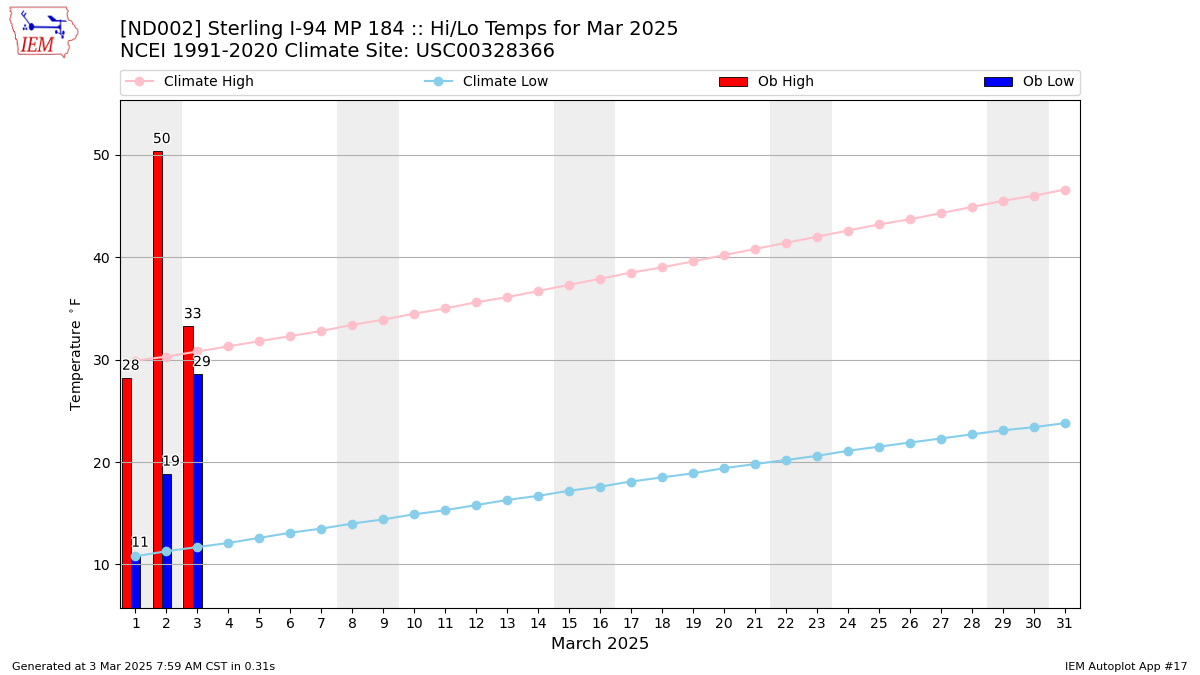
Description: This chart of the monthly temperature data. The bars are the observations and the dots are climatology.
Daily Rainfall
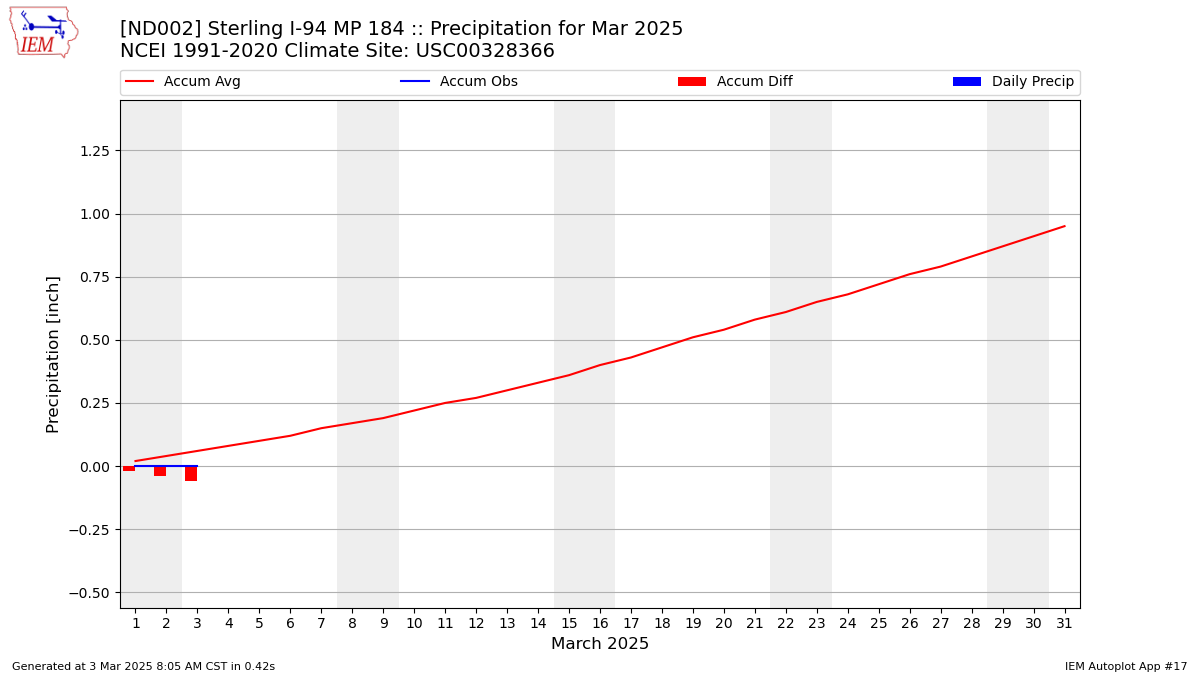
Description: This chart is of daily precipitation for the month. The red line would be an average month while the blue line and bars are observations.
Daily Average Wind Speeds
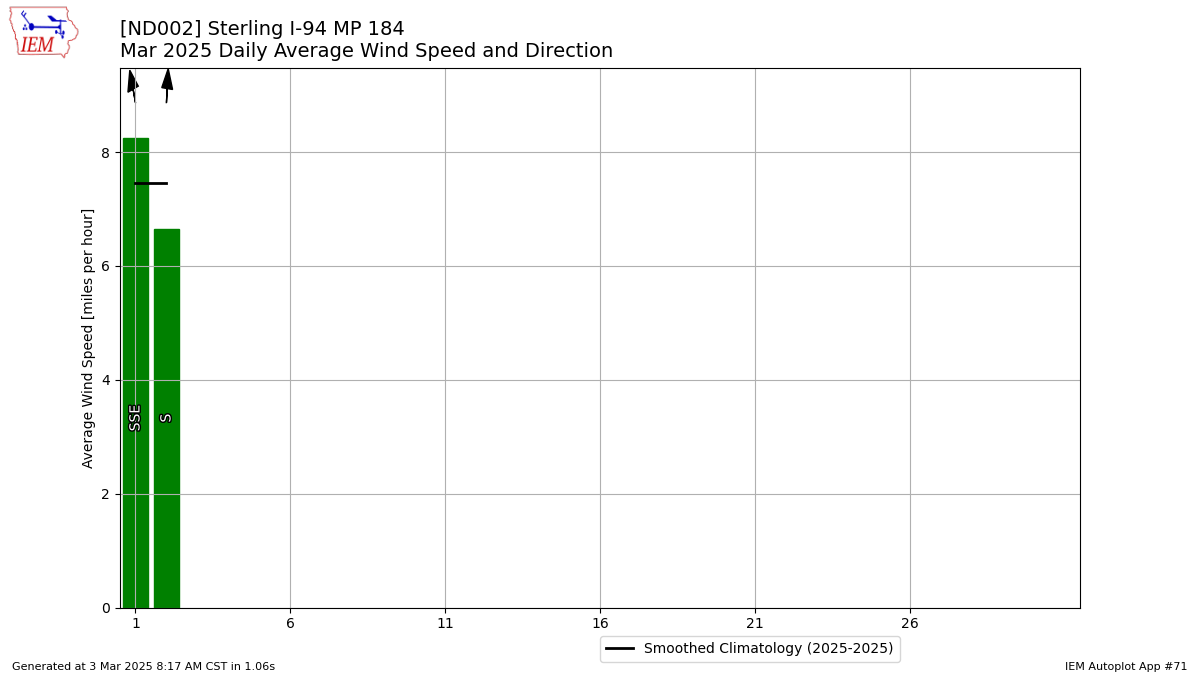
Description: This chart is of the daily average wind speeds.
The data presented here provided by IEM API webservice: daily.json. A simple CSV option exists as well.