Information Last Ob Photographs Calibration Meteogram Network Table Neighbors Monthly Summaries Observation History Wind Roses Custom Wind Roses Data Calendar
| Mar 2025 | Apr 2025 | May 2025 | ||||
|---|---|---|---|---|---|---|
| Sunday | Monday | Tuesday | Wednesday | Thursday | Friday | Saturday |
| 30 | 31 | 01 High: 49.19 Low: 32.8838 Precip: 0.00 Avg Wind: NNE @ 2.6 Gust: 8 (1:45 PM) RH% Min/Max: 65-92 Feel Min/Max: 33 to 48 | 02 High: 72.05 Low: 45.5036 Precip: 0.53 Avg Wind: ESE @ 7.8 Gust: 30 (2:15 PM) RH% Min/Max: 49-100 Feel Min/Max: 44 to 71 | 03 High: 52.718 Low: 37.67 Precip: 0.07 Avg Wind: SW @ 4.5 Gust: 16 (9:00 AM) RH% Min/Max: 60-99 Feel Min/Max: 32 to 52 | 04 High: 47.03 Low: 35.2166 Precip: 0.15 Avg Wind: NNW @ 3.4 Gust: 10 (6:00 PM) RH% Min/Max: 90-100 Feel Min/Max: 32 to 47 | 05 High: 47.768 Low: 34.664 Precip: 0.02 Avg Wind: W @ 8.0 Gust: 20 (12:45 PM) RH% Min/Max: 39-100 Feel Min/Max: 31 to 45 |
| 06 High: 54.068 Low: 24.9062 Precip: 0.14 Avg Wind: SW @ 3.8 Gust: 11 (12:15 AM) RH% Min/Max: 35-97 Feel Min/Max: 25 to 54 | 07 High: 44.8286 Low: 29.6294 Precip: 0.00 Avg Wind: W @ 7.4 Gust: 20 (12:00 PM) RH% Min/Max: 35-98 Feel Min/Max: 28 to 40 | 08 High: 54.41 Low: 23.6228 Precip: 0.00 Avg Wind: NE @ 1.8 Gust: 14 (1:45 PM) RH% Min/Max: 32-78 Feel Min/Max: 24 to 54 | 09 High: 66.29 Low: 40.9748 Precip: 0.00 Avg Wind: N @ 2.3 Gust: 12 (4:30 PM) RH% Min/Max: 46-77 Feel Min/Max: 41 to 66 | 10 High: 62.942 Low: 38.7104 Precip: 0.00 Avg Wind: W @ 5.5 Gust: 21 (3:30 PM) RH% Min/Max: 54-100 Feel Min/Max: 39 to 62 | 11 High: 53.114 Low: 40.0676 Precip: 0.00 Avg Wind: W @ 2.9 Gust: 10 (1:00 AM) RH% Min/Max: 65-100 Feel Min/Max: 40 to 53 | 12 High: 68.99 Low: 32.945 Precip: 0.00 Avg Wind: ENE @ 2.2 Gust: 16 (3:30 PM) RH% Min/Max: 47-100 Feel Min/Max: 33 to 69 |
| 13 High: 77.72 Low: 52.322 Precip: 0.00 Avg Wind: ESE @ 4.0 Gust: 17 (11:30 PM) RH% Min/Max: 50-75 Feel Min/Max: 52 to 77 | 14 High: 64.616 Low: 48.848 Precip: M Gust: 23 (4:45 PM) RH% Min/Max: 39-74 Feel Min/Max: 44 to 65 | 15 Precip: M | 16 | 17 | 18 | 19 |
| 20 | 21 | 22 | 23 | 24 | 25 | 26 |
| 27 | 28 | 29 | 30 | 01 | 02 | 03 |
The data presented here provided by IEM API webservice: daily.json. A simple CSV option exists as well.
Daily High/Low Plot
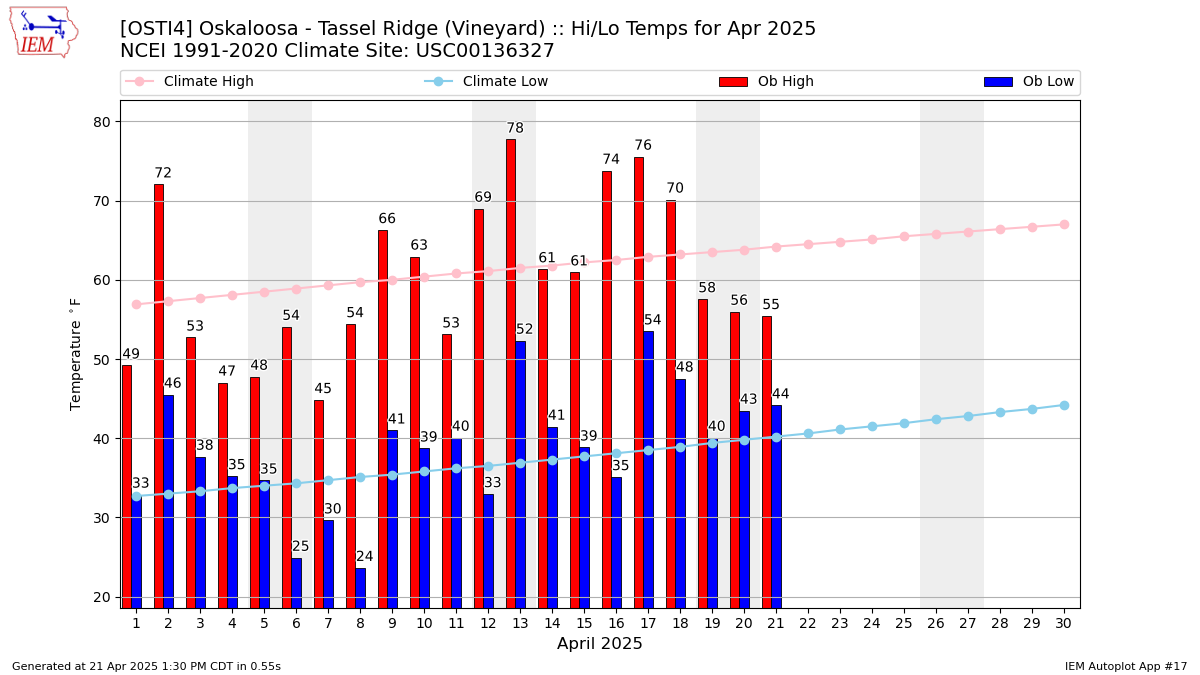
Description: This chart of the monthly temperature data. The bars are the observations and the dots are climatology.
Daily Rainfall
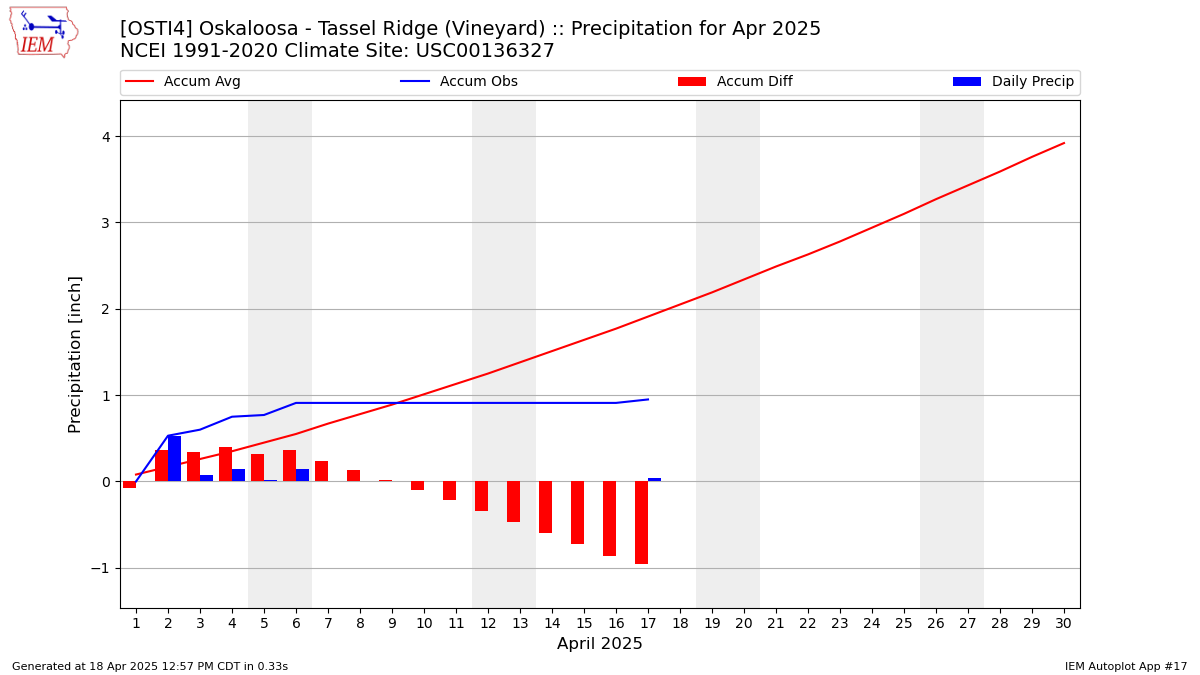
Description: This chart is of daily precipitation for the month. The red line would be an average month while the blue line and bars are observations.
Daily Average Wind Speeds
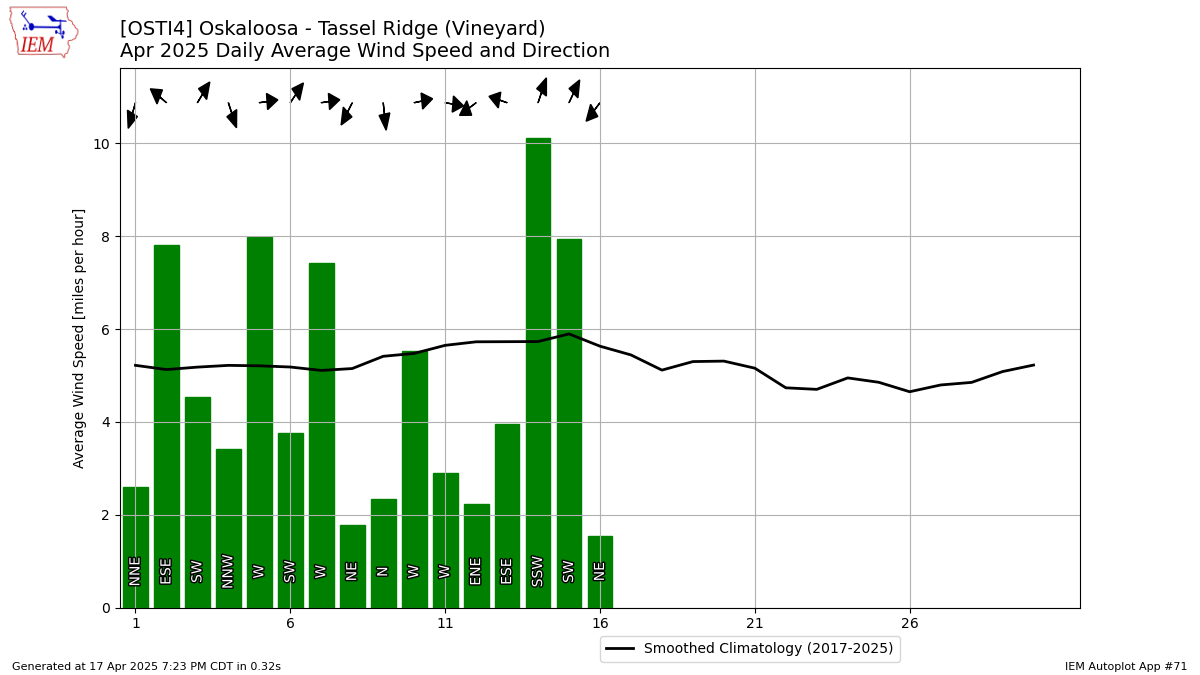
Description: This chart is of the daily average wind speeds.
The data presented here provided by IEM API webservice: daily.json. A simple CSV option exists as well.