Information Last Ob Photographs Calibration Meteogram Network Table Neighbors Monthly Summaries Observation History Wind Roses Custom Wind Roses Data Calendar
| Mar 2025 | Apr 2025 | May 2025 | ||||
|---|---|---|---|---|---|---|
| Sunday | Monday | Tuesday | Wednesday | Thursday | Friday | Saturday |
| 30 | 31 | 01 High: 37.2254 Low: 30.5168 Precip: 0.09 Gust: 1 (12:00 AM) RH% Min/Max: 80-98 Feel Min/Max: 31 to 37 | 02 High: 38.894 Low: 32.009 Precip: 1.13 Gust: 1 (12:00 AM) RH% Min/Max: 87-100 Feel Min/Max: 32 to 39 | 03 High: 45.2282 Low: 31.316 Precip: 0.00 Gust: 1 (12:00 AM) RH% Min/Max: 67-95 Feel Min/Max: 31 to 45 | 04 High: 51.926 Low: 30.4502 Precip: 0.00 Gust: 1 (9:13 AM) RH% Min/Max: 64-98 Feel Min/Max: 30 to 52 | 05 High: 44.465 Low: 23.1962 Precip: 0.00 Gust: 1 (12:00 AM) RH% Min/Max: 38-95 Feel Min/Max: 23 to 44 |
| 06 High: 61.448 Low: 22.901 Precip: 0.00 Gust: 1 (12:00 AM) RH% Min/Max: 24-88 Feel Min/Max: 23 to 61 | 07 High: 41.972 Low: 24.5 Precip: 0.00 Gust: 1 (12:00 AM) RH% Min/Max: 24-84 Feel Min/Max: 23 to 42 | 08 High: 59 Low: 17.7872 Precip: 0.00 Gust: 1 (10:28 AM) RH% Min/Max: 24-82 Feel Min/Max: 18 to 59 | 09 High: 71.87 Low: 34.4228 Precip: 0.00 Gust: 1 (12:00 AM) RH% Min/Max: 17-74 Feel Min/Max: 34 to 72 | 10 High: 61.898 Low: 38.5682 Precip: 0.00 Gust: 1 (8:07 AM) RH% Min/Max: 41-89 Feel Min/Max: 39 to 62 | 11 High: 64.67 Low: 26.2382 Precip: 0.00 Gust: 1 (12:00 AM) RH% Min/Max: 31-100 Feel Min/Max: 26 to 65 | 12 High: 80.276 Low: 43.574 Precip: 0.00 Gust: 1 (10:22 AM) RH% Min/Max: 27-74 Feel Min/Max: 44 to 80 |
| 13 High: 76.352 Low: 48.02 Precip: 0.00 Gust: 1 (12:00 AM) RH% Min/Max: 32-74 Feel Min/Max: 48 to 76 | 14 High: 49.856 Low: 42.2168 Precip: M Gust: 1 (12:00 AM) RH% Min/Max: 50-74 Feel Min/Max: 42 to 50 | 15 Precip: M | 16 | 17 | 18 | 19 |
| 20 | 21 | 22 | 23 | 24 | 25 | 26 |
| 27 | 28 | 29 | 30 | 01 | 02 | 03 |
The data presented here provided by IEM API webservice: daily.json. A simple CSV option exists as well.
Daily High/Low Plot
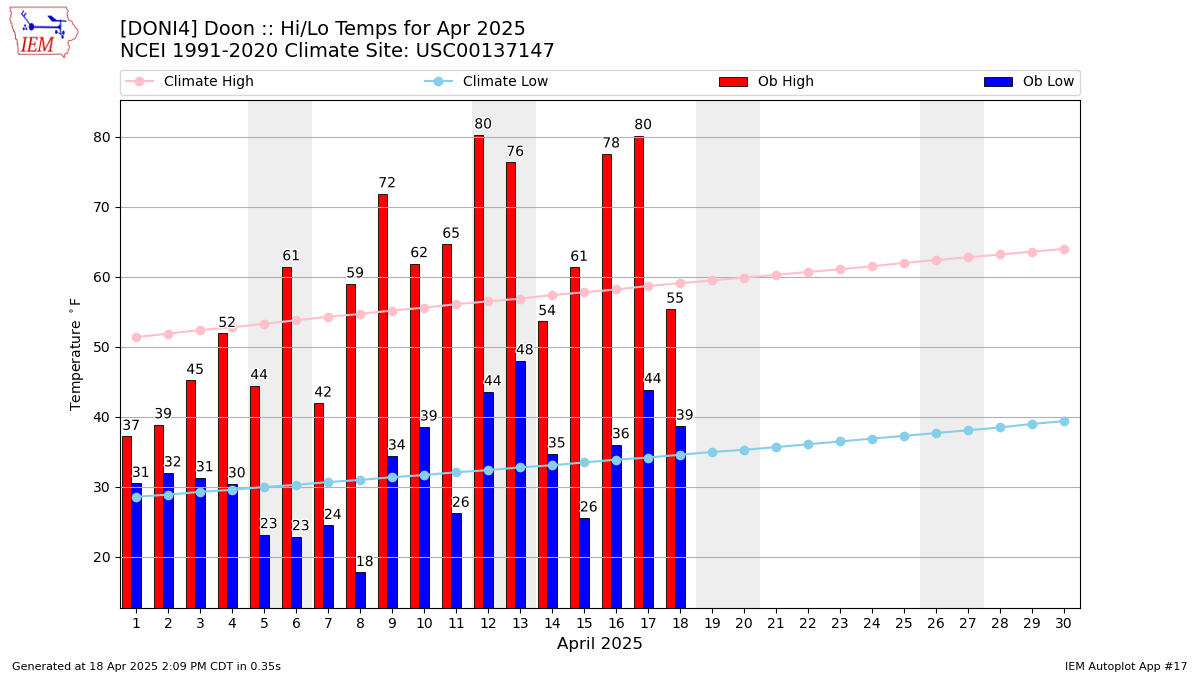
Description: This chart of the monthly temperature data. The bars are the observations and the dots are climatology.
Daily Rainfall
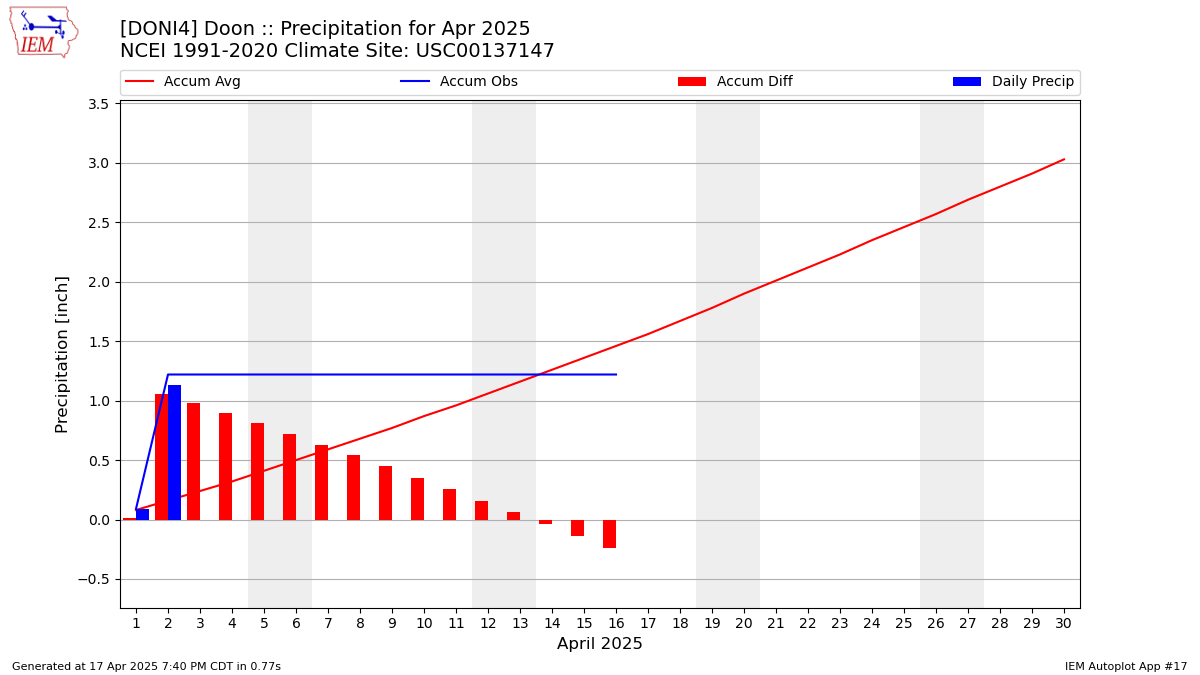
Description: This chart is of daily precipitation for the month. The red line would be an average month while the blue line and bars are observations.
Daily Average Wind Speeds
Description: This chart is of the daily average wind speeds.
The data presented here provided by IEM API webservice: daily.json. A simple CSV option exists as well.