Information Last Ob Photographs Calibration Meteogram Network Table Neighbors Monthly Summaries Observation History Wind Roses Custom Wind Roses Data Calendar
| Mar 2025 | Apr 2025 | May 2025 | ||||
|---|---|---|---|---|---|---|
| Sunday | Monday | Tuesday | Wednesday | Thursday | Friday | Saturday |
| 30 | 31 | 01 High: 44.3552 Low: 30.4898 Precip: 0.02 Gust: 32 (3:41 PM) RH% Min/Max: 70-93 Feel Min/Max: 24 to 37 | 02 High: 67.784 Low: 39.9704 Precip: 0.55 Gust: 36 (2:41 PM) RH% Min/Max: 63-99 Feel Min/Max: 34 to 68 | 03 High: 51.026 Low: 33.4346 Precip: 0.00 Gust: 24 (2:57 AM) RH% Min/Max: 59-93 Feel Min/Max: 25 to 51 | 04 High: 51.674 Low: 31.3322 Precip: 0.00 Gust: 13 (3:24 PM) RH% Min/Max: 60-97 Feel Min/Max: 26 to 52 | 05 High: 48.128 Low: 31.6 Precip: 0.00 Gust: 29 (8:55 AM) RH% Min/Max: 32-92 Feel Min/Max: 22 to 41 |
| 06 High: 59.288 Low: 21.4754 Precip: 0.00 Gust: 17 (3:18 PM) RH% Min/Max: 27-91 Feel Min/Max: 17 to 59 | 07 High: 46.58 Low: 28.7 Precip: 0.00 Gust: 29 (11:45 AM) RH% Min/Max: 26-81 Feel Min/Max: 20 to 40 | 08 High: 53.96 Low: 16.682 Precip: 0.00 Gust: 17 (2:57 PM) RH% Min/Max: 22-86 Feel Min/Max: 13 to 54 | 09 High: 66.524 Low: 38.7248 Precip: 0.00 Gust: 17 (2:37 PM) RH% Min/Max: 34-69 Feel Min/Max: 34 to 67 | 10 High: 62.546 Low: 38.3486 Precip: 0.00 Gust: 28 (11:58 AM) RH% Min/Max: 46-84 Feel Min/Max: 36 to 63 | 11 High: 58.244 Low: 38.3666 Precip: 0.00 Gust: 18 (12:13 AM) RH% Min/Max: 47-92 Feel Min/Max: 35 to 58 | 12 High: 72.698 Low: 33.1484 Precip: 0.00 Gust: 28 (3:23 PM) RH% Min/Max: 32-96 Feel Min/Max: 31 to 73 |
| 13 High: 77.918 Low: 52.61 Precip: 0.00 Gust: 25 (10:18 PM) RH% Min/Max: 39-64 Feel Min/Max: 53 to 78 | 14 High: 60.98 Low: 40.334 Precip: 0.04 Gust: 37 (6:24 PM) RH% Min/Max: 36-86 Feel Min/Max: 31 to 61 | 15 High: 62.348 Low: 33.9674 Precip: 0.00 Gust: 28 (12:06 PM) RH% Min/Max: 24-89 Feel Min/Max: 25 to 62 | 16 High: 76.622 Low: 35.8 Precip: 0.00 Gust: 25 (2:56 PM) RH% Min/Max: 21-77 Feel Min/Max: 28 to 77 | 17 High: 79.52 Low: 52.574 Precip: 0.12 Gust: 25 (1:57 PM) RH% Min/Max: 41-83 Feel Min/Max: 53 to 80 | 18 High: 66.092 Low: 44.3588 Precip: 0.02 Gust: 27 (9:49 PM) RH% Min/Max: 55-99 Feel Min/Max: 37 to 66 | 19 High: 57.308 Low: 36.9554 Precip: 0.00 Gust: 20 (11:02 AM) RH% Min/Max: 31-79 Feel Min/Max: 30 to 57 |
| 20 High: 48.65 Low: 38.03 Precip: 1.24 Gust: 27 (8:52 PM) RH% Min/Max: 55-100 Feel Min/Max: 33 to 45 | 21 High: 65.768 Low: 41.5364 Precip: 0.00 Gust: 23 (1:00 AM) RH% Min/Max: 46-100 Feel Min/Max: 34 to 66 | 22 High: 72.194 Low: 51.242 Precip: 0.11 Gust: 29 (1:18 AM) RH% Min/Max: 37-91 Feel Min/Max: 51 to 72 | 23 High: 75.938 Low: 51.566 Precip: 0.35 Gust: 25 (4:05 AM) RH% Min/Max: 52-98 Feel Min/Max: 52 to 76 | 24 High: 69.89 Low: 52.142 Precip: 0.12 Gust: 20 (10:38 PM) RH% Min/Max: 76-97 Feel Min/Max: 52 to 70 | 25 High: 55.868 Low: 46.5 Precip: 0.61 Gust: 35 (12:46 AM) RH% Min/Max: 83-100 Feel Min/Max: 40 to 56 | 26 High: 62.672 Low: 37.6484 Precip: 0.00 Gust: 19 (2:07 PM) RH% Min/Max: 41-100 Feel Min/Max: 34 to 63 |
| 27 High: 50.36 Low: 46.1156 Precip: M Gust: 18 (7:56 AM) RH% Min/Max: 71-81 Feel Min/Max: 42 to 50 | 28 Precip: M | 29 | 30 | 01 | 02 | 03 |
The data presented here provided by IEM API webservice: daily.json. A simple CSV option exists as well.
Daily High/Low Plot

Description: This chart of the monthly temperature data. The bars are the observations and the dots are climatology.
Daily Rainfall
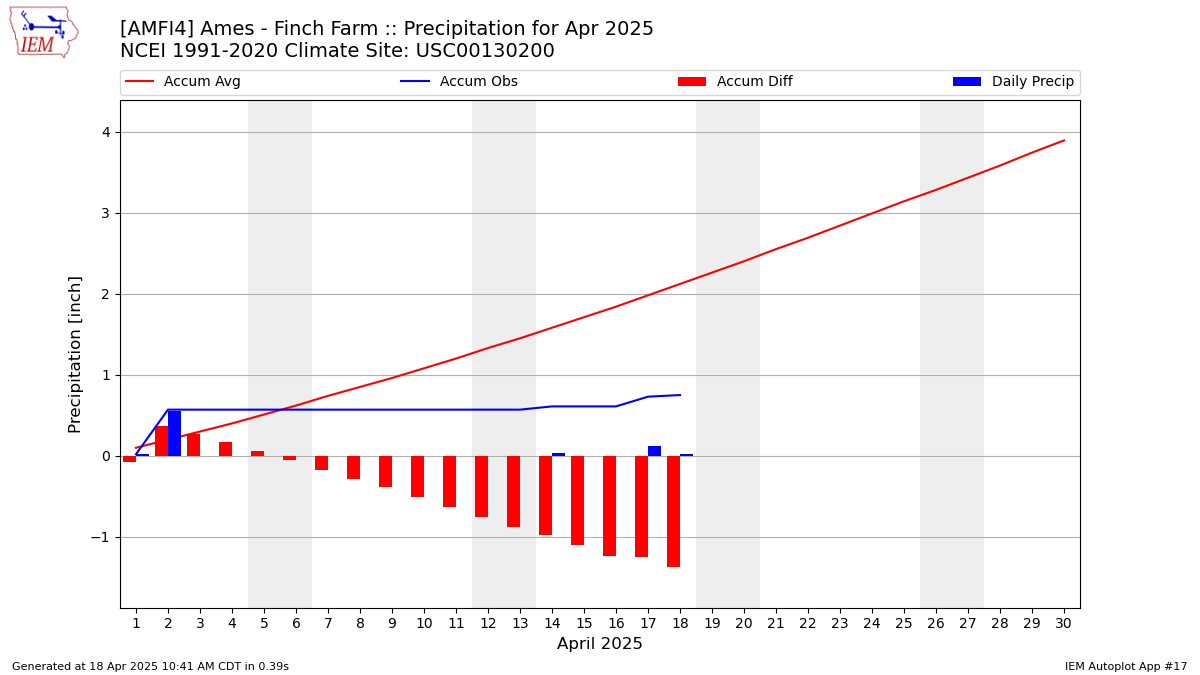
Description: This chart is of daily precipitation for the month. The red line would be an average month while the blue line and bars are observations.
Daily Average Wind Speeds

Description: This chart is of the daily average wind speeds.
The data presented here provided by IEM API webservice: daily.json. A simple CSV option exists as well.