Automated Data Plotter
This application dynamically generates many types of graphs derived from various IEM data sources. Feel free to use these generated graphics in whatever way you wish.
1 Select a Chart Type
2 Configure Chart Options
Plot Description:
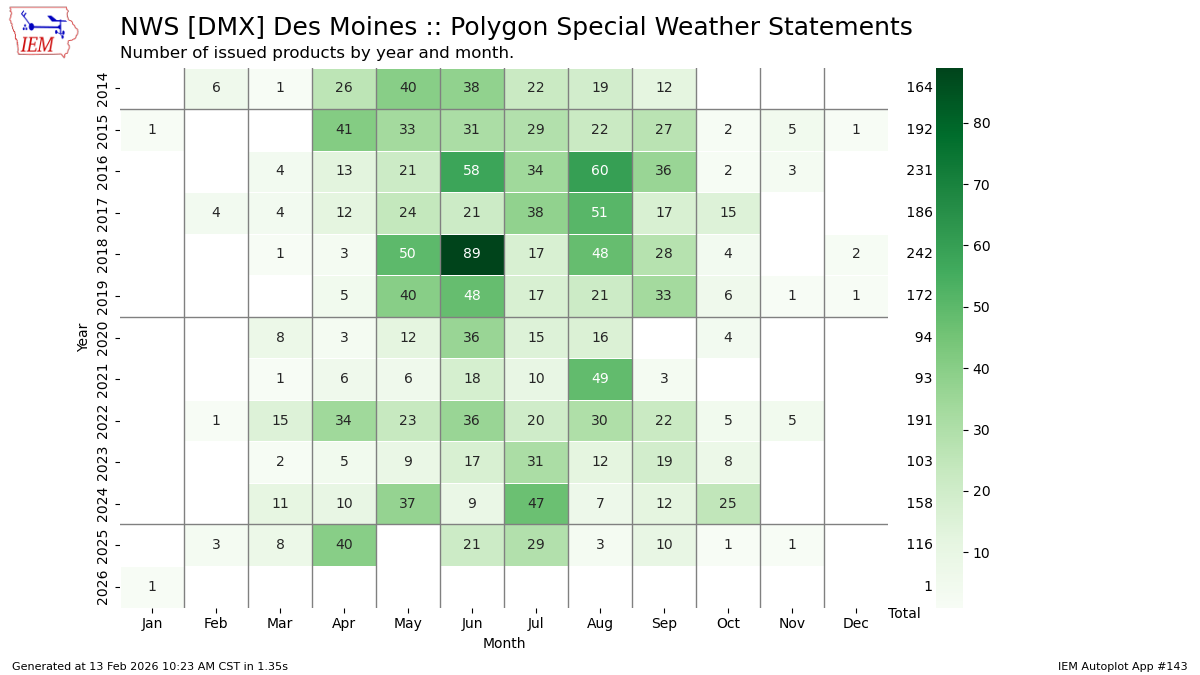
The NWS issues Special Weather Statements (SPS) products that often cover events that are just below severe limits and/or not covered by other headline products. Sometimes these SPS products have polygons. This app provides a monthly total of the number of such SPS products.3 Generated Chart
Based on recent timings, plot generation averages 3 seconds. Please wait while your chart is being generated...
If you notice plotting issues with the image above, please
contact us
and provide the URL address currently shown by your web browser.
IEM Daily Features using this plot
The IEM Daily Features found on this website often utilize plots found on this application. Here is a listing of features referencing this plot type.
- 03 Jun 2025: SPS Polygon Counts
- 27 Sep 2023: Special Weather Statements