Automated Data Plotter
This application dynamically generates many types of graphs. These graphs are derived from processing of various data sources done by the IEM. Please feel free to use these generated graphics in whatever way you wish. Reset App. The IEM Explorer application offers a simplified frontend to some of these autoplots.
Second, select specific chart options::
Plot Description:
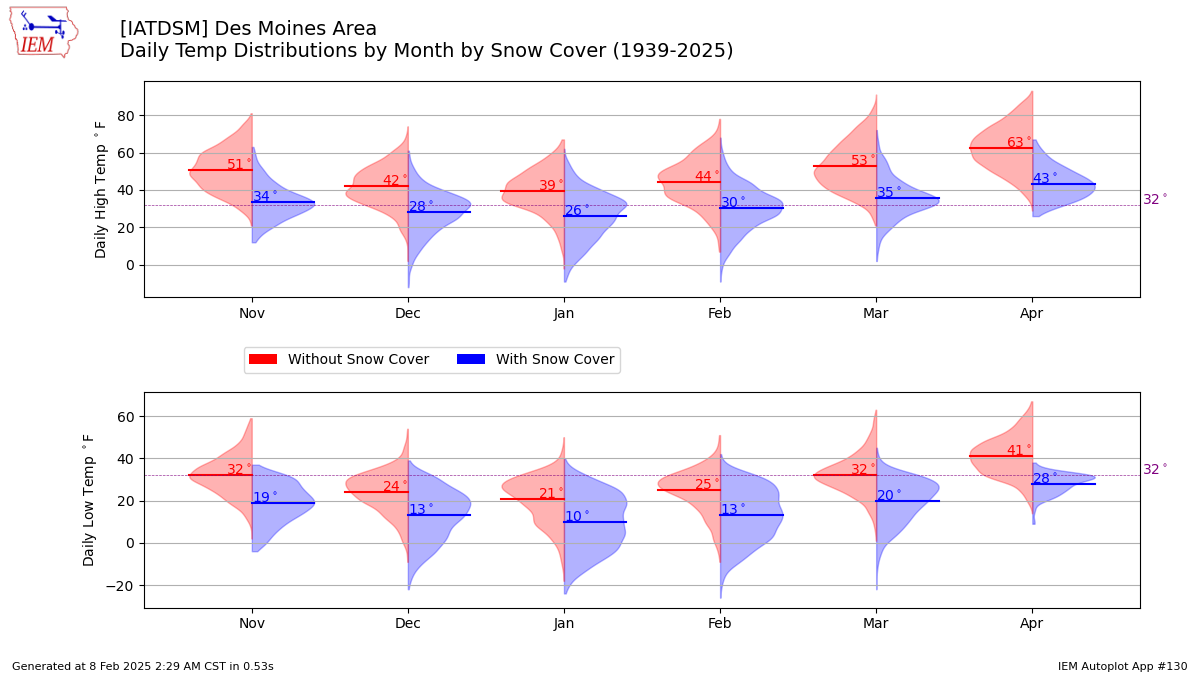
This chart presents violin plots of the distribution of daily high and low temperatures on dates with and without snow cover by month. A given month is plotted when at least 1% of the days on record for the month had snowcover. There are a number of caveats due to the timing of the daily temperature and snow cover report. Also with the quality of the snow cover data.Based on a sampling of recent timings for this application, plot generation time has averaged 2 seconds. Hold on for the plot is generating now!
 View Data (as csv)
Download as Excel
View Data (as csv)
Download as Excel
If you notice plotting issues with the image above, please
do let us know
by providing the
URL address currently shown by your web browser.
IEM Daily Features using this plot
The IEM Daily Features found on this website often utilize plots found on this application. Here is a listing of features referencing this plot type.
- 29 Nov 2023: Big Difference for November
- 28 Nov 2022: Snow Cover Temp Difference
- 16 Dec 2020: Snow Cover and Highs / Lows
- 09 Nov 2018: With and Without Snow Cover
- 09 Nov 2017: Snow Makes Big Difference
- 07 Dec 2015: Snow Cover Impact
- 06 Dec 2010: Cold even without snow
- 12 Dec 2008: Snow cover makes a difference