IEM Daily Feature
Thursday, 27 March 2025
Thursday, 27 March 2025
Climatology Pull
Posted: 27 Mar 2025 05:30 AM
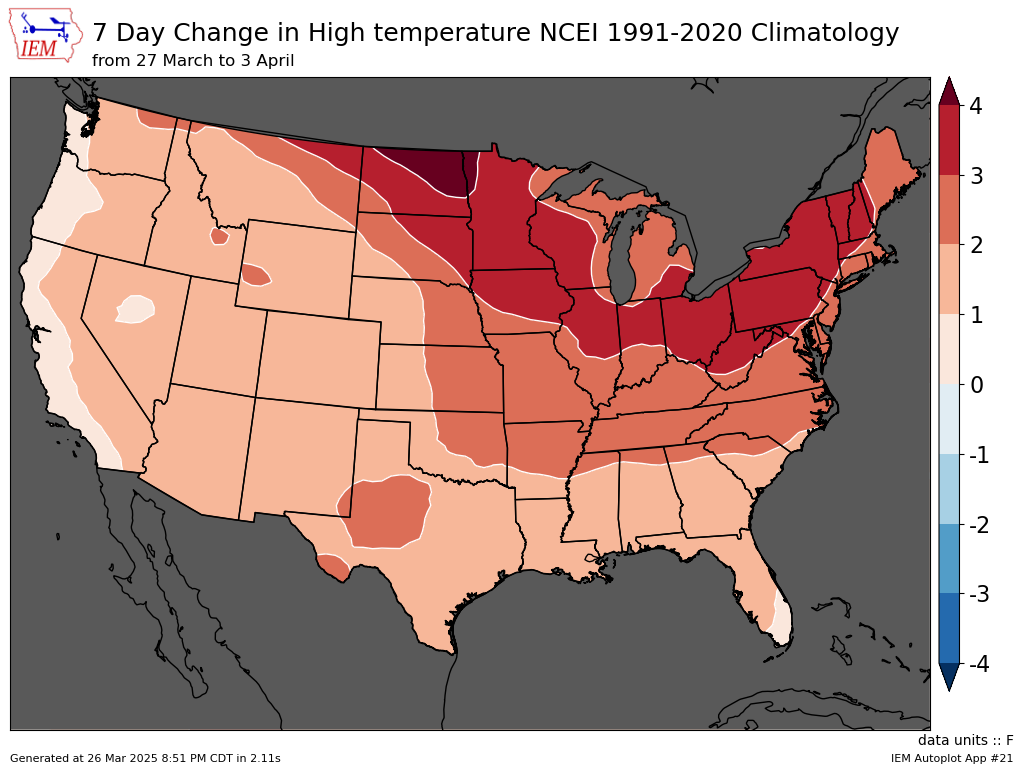
Yesterday's daily feature looked into the warming of soils during late March. Today's featured map looks into the warming of air temperatures by plotting the change in NCEI 1991-2020 climatology over the coming seven day period. Much of Iowa is shown in the 3-4 degree range meaning that average high temperatures on 3 April are that much warmer than average values on 27 March. Such is the strong pull of climatology this time of year as soil temperatures continue to warm, solar inputs increase daily, and frequency of snow cover decreases. The pattern shown over the contiguous US is certainly interesting with the weakest amount of warming found along the Pacific coast, which is heavily modulated by the ocean. You can also see some effect over Michigan as the chillier Great Lakes dampen the warming this time of year as well.
Voting:
Good = 12
Bad = 0
Voting:
Good = 12
Bad = 0