Information Last Ob Photographs Meteogram Network Table Neighbors Monthly Summaries Observation History Wind Roses Custom Wind Roses Data Calendar
| Aug 2024 | Sep 2024 | Oct 2024 | ||||
|---|---|---|---|---|---|---|
| Sunday | Monday | Tuesday | Wednesday | Thursday | Friday | Saturday |
| 01 High: 72.03922 Low: 59.540024 Rain: RH% Min/Max: 45-80 Feel Min/Max: 60 to 72 | 02 High: 74.56998 Low: 49.91001 Rain: RH% Min/Max: 36-85 Feel Min/Max: 50 to 74 | 03 High: 76.049614 Low: 51.330215 Rain: RH% Min/Max: 37-92 Feel Min/Max: 51 to 76 | 04 High: 80.02041 Low: 52.840393 Rain: RH% Min/Max: 31-89 Feel Min/Max: 53 to 80 | 05 High: 78.81982 Low: 53.38938 Rain: RH% Min/Max: 51-92 Feel Min/Max: 54 to 79 | 06 High: 64.990395 Low: 47.840023 Rain: RH% Min/Max: 51-90 Feel Min/Max: 46 to 65 | 07 High: 61.340023 Low: 44.560383 Rain: RH% Min/Max: 45-87 Feel Min/Max: 40 to 61 |
| 08 High: 73.45042 Low: 44.659424 Rain: RH% Min/Max: 45-86 Feel Min/Max: 44 to 73 | 09 High: 80.09962 Low: 57.57979 Rain: RH% Min/Max: 50-92 Feel Min/Max: 58 to 80 | 10 High: 81.12019 Low: 53.04018 Rain: RH% Min/Max: 30-97 Feel Min/Max: 53 to 80 | 11 High: 84.070404 Low: 59.640823 Rain: RH% Min/Max: 32-83 Feel Min/Max: 60 to 83 | 12 High: 82.90041 Low: 55.180428 Rain: RH% Min/Max: 38-89 Feel Min/Max: 55 to 82 | 13 High: 79.23022 Low: 58.47078 Rain: RH% Min/Max: 50-94 Feel Min/Max: 58 to 79 | 14 High: 81.46939 Low: 58.870407 Rain: RH% Min/Max: 53-94 Feel Min/Max: 59 to 83 |
| 15 High: 83.33059 Low: 59.970192 Rain: RH% Min/Max: 47-93 Feel Min/Max: 60 to 85 | 16 High: 85.22062 Low: 57.599617 Rain: RH% Min/Max: 35-93 Feel Min/Max: 58 to 85 | 17 High: 83.310814 Low: 54.33981 Rain: RH% Min/Max: 33-91 Feel Min/Max: 54 to 83 | 18 High: 79.559586 Low: 52.759426 Rain: RH% Min/Max: 51-93 Feel Min/Max: 53 to 80 | 19 High: 85.36998 Low: 54.370407 Rain: RH% Min/Max: 36-96 Feel Min/Max: 54 to 84 | 20 High: 83.48 Low: 59.250202 Rain: RH% Min/Max: 37-95 Feel Min/Max: 61 to 83 | 21 High: 85.020775 Low: 54.669178 Rain: RH% Min/Max: 36-90 Feel Min/Max: 55 to 84 |
| 22 High: 67.28 Low: 56.01918 Rain: RH% Min/Max: 90-97 Feel Min/Max: 56 to 67 | 23 High: 68.199776 Low: 49.8308 Rain: RH% Min/Max: 56-92 Feel Min/Max: 47 to 68 | 24 High: 62.61982 Low: 55.360382 Rain: RH% Min/Max: 87-96 Feel Min/Max: 55 to 63 | 25 High: 74.1308 Low: 53.49919 Rain: RH% Min/Max: 45-93 Feel Min/Max: 53 to 74 | 26 High: 77.7002 Low: 53.549618 Rain: RH% Min/Max: 38-91 Feel Min/Max: 54 to 78 | 27 High: 74.26038 Low: 52.689224 Rain: RH% Min/Max: 40-99 Feel Min/Max: 53 to 74 | 28 High: 76.229576 Low: 58.080215 Rain: RH% Min/Max: 38-87 Feel Min/Max: 58 to 76 |
| 29 High: M Low: M Rain: | 30 | 01 | 02 | 03 | 04 | 05 |
The data presented here provided by IEM API webservice: daily.json. A simple CSV option exists as well.
Daily High/Low Plot

Description: This chart of the monthly temperature data. The bars are the observations and the dots are climatology.
Daily Rainfall
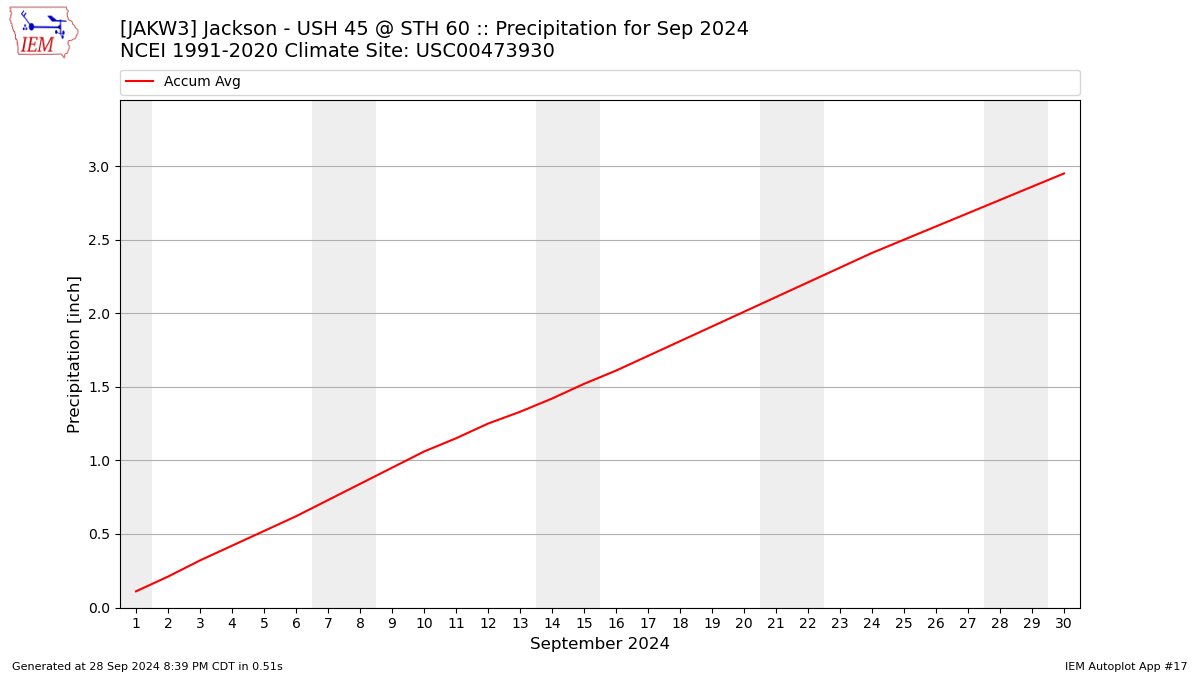
Description: This chart is of daily precipitation for the month. The red line would be an average month while the blue line and bars are observations.
Daily Average Wind Speeds

Description: This chart is of the daily average wind speeds.
The data presented here provided by IEM API webservice: daily.json. A simple CSV option exists as well.