Information Last Ob Photographs Meteogram Network Table Neighbors Monthly Summaries Observation History Wind Roses Custom Wind Roses Data Calendar
| Aug 2024 | Sep 2024 | Oct 2024 | ||||
|---|---|---|---|---|---|---|
| Sunday | Monday | Tuesday | Wednesday | Thursday | Friday | Saturday |
| 01 High: 86.95399 Low: 68.26998 Rain: RH% Min/Max: 36-96 Feel Min/Max: 68 to 87 | 02 High: 84.037994 Low: 64.16598 Rain: RH% Min/Max: 36-82 Feel Min/Max: 64 to 83 | 03 High: 82.25601 Low: 56.623978 Rain: RH% Min/Max: 39-74 Feel Min/Max: 57 to 82 | 04 High: 87.511986 Low: 64.076004 Rain: RH% Min/Max: 45-89 Feel Min/Max: 64 to 89 | 05 High: 91.868004 Low: 62.79802 Rain: RH% Min/Max: 36-97 Feel Min/Max: 63 to 92 | 06 High: 90.86001 Low: 64.43603 Rain: RH% Min/Max: 38-92 Feel Min/Max: 64 to 92 | 07 High: 72.787994 Low: 52.88 Rain: RH% Min/Max: 33-80 Feel Min/Max: 53 to 73 |
| 08 High: 72.26598 Low: 45.91401 Rain: RH% Min/Max: 26-95 Feel Min/Max: 46 to 72 | 09 High: 78.83602 Low: 44.097805 Rain: RH% Min/Max: 28-95 Feel Min/Max: 44 to 79 | 10 High: 88.46598 Low: 48.506012 Rain: RH% Min/Max: 21-96 Feel Min/Max: 49 to 85 | 11 High: 92.768005 Low: 53.33 Rain: RH% Min/Max: 29-94 Feel Min/Max: 53 to 91 | 12 High: 79.16001 Low: 63.536026 Rain: RH% Min/Max: 48-93 Feel Min/Max: 64 to 79 | 13 High: 87.223976 Low: 64.27398 Rain: RH% Min/Max: 51-95 Feel Min/Max: 64 to 91 | 14 High: 90.31998 Low: 67.96401 Rain: RH% Min/Max: 40-97 Feel Min/Max: 68 to 93 |
| 15 High: 88.51998 Low: 64.76001 Rain: RH% Min/Max: 43-98 Feel Min/Max: 65 to 90 | 16 High: 90.08602 Low: 63.769978 Rain: RH% Min/Max: 36-89 Feel Min/Max: 64 to 90 | 17 High: 88.46598 Low: 56.822006 Rain: RH% Min/Max: 26-96 Feel Min/Max: 57 to 86 | 18 High: 83.55202 Low: 62.56401 Rain: RH% Min/Max: 53-92 Feel Min/Max: 63 to 85 | 19 High: 89.94199 Low: 63.140022 Rain: RH% Min/Max: 40-96 Feel Min/Max: 63 to 92 | 20 High: 92.89402 Low: 63.49999 Rain: RH% Min/Max: 36-96 Feel Min/Max: 63 to 94 | 21 High: 88.35799 Low: 70.591995 Rain: RH% Min/Max: 56-97 Feel Min/Max: 71 to 95 |
| 22 High: M Low: M Rain: | 23 | 24 | 25 | 26 | 27 | 28 |
| 29 | 30 | 01 | 02 | 03 | 04 | 05 |
The data presented here provided by IEM API webservice: daily.json. A simple CSV option exists as well.
Daily High/Low Plot

Description: This chart of the monthly temperature data. The bars are the observations and the dots are climatology.
Daily Rainfall
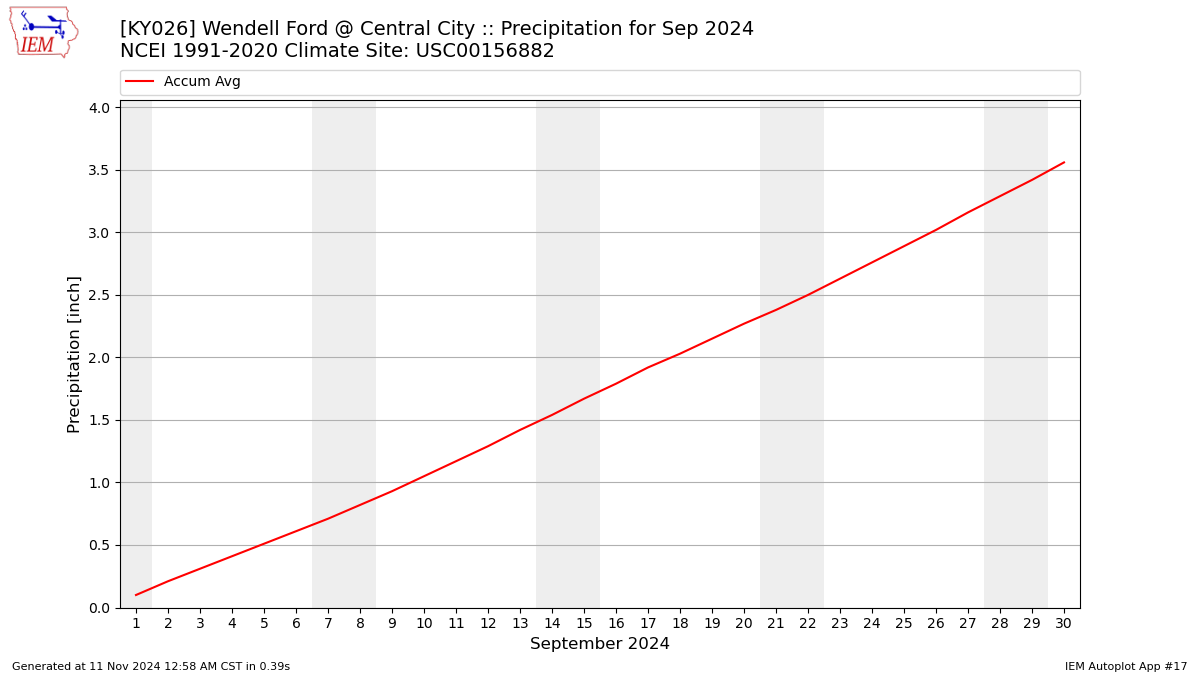
Description: This chart is of daily precipitation for the month. The red line would be an average month while the blue line and bars are observations.
Daily Average Wind Speeds
Description: This chart is of the daily average wind speeds.
The data presented here provided by IEM API webservice: daily.json. A simple CSV option exists as well.