Information Last Ob Photographs Meteogram Network Table Neighbors Monthly Summaries Observation History Wind Roses Custom Wind Roses Data Calendar
| Aug 2024 | Sep 2024 | Oct 2024 | ||||
|---|---|---|---|---|---|---|
| Sunday | Monday | Tuesday | Wednesday | Thursday | Friday | Saturday |
| 01 High: 88.16001 Low: 70.502014 Rain: RH% Min/Max: 29-78 Feel Min/Max: 73 to 86 | 02 High: 84.973976 Low: 62.887997 Rain: RH% Min/Max: 30-74 Feel Min/Max: 63 to 83 | 03 High: 83.28203 Low: 58.99999 Rain: RH% Min/Max: 27-65 Feel Min/Max: 59 to 81 | 04 High: 85.118004 Low: 66.434 Rain: RH% Min/Max: 44-90 Feel Min/Max: 66 to 86 | 05 High: 94.06401 Low: 63.23 Rain: RH% Min/Max: 26-100 Feel Min/Max: 63 to 92 | 06 High: 90.35601 Low: 65.17397 Rain: RH% Min/Max: 33-100 Feel Min/Max: 65 to 90 | 07 High: 75.41598 Low: 58.027973 Rain: RH% Min/Max: 27-72 Feel Min/Max: 58 to 75 |
| 08 High: 75.50601 Low: 51.872005 Rain: RH% Min/Max: 24-80 Feel Min/Max: 52 to 76 | 09 High: 82.32797 Low: 47.911983 Rain: RH% Min/Max: 17-92 Feel Min/Max: 48 to 80 | 10 High: 90.03203 Low: 51.34999 Rain: RH% Min/Max: 17-88 Feel Min/Max: 51 to 86 | 11 High: 93.38 Low: 58.53203 Rain: RH% Min/Max: 21-72 Feel Min/Max: 59 to 90 | 12 High: 77.64802 Low: 63.787994 Rain: RH% Min/Max: 38-100 Feel Min/Max: 64 to 78 | 13 High: 81.841995 Low: 63.841995 Rain: RH% Min/Max: 52-100 Feel Min/Max: 64 to 83 | 14 High: 64.76001 Low: 41.96118 Rain: |
| 15 High: 65.60601 Low: 33.812622 Rain: RH% Min/Max: 85-100 Feel Min/Max: 64 to 66 | 16 High: 80.04199 Low: 63.319977 Rain: RH% Min/Max: 45-91 Feel Min/Max: 63 to 83 | 17 High: 86.287994 Low: 59.468006 Rain: RH% Min/Max: 25-98 Feel Min/Max: 59 to 83 | 18 High: 85.87398 Low: 60.872005 Rain: RH% Min/Max: 37-90 Feel Min/Max: 61 to 85 | 19 High: 89.09599 Low: 63.086025 Rain: RH% Min/Max: 35-100 Feel Min/Max: 64 to 88 | 20 High: 89.726006 Low: 63.122005 Rain: RH% Min/Max: 39-100 Feel Min/Max: 64 to 90 | 21 High: 89.88799 Low: 70.46598 Rain: RH% Min/Max: 44-86 Feel Min/Max: 70 to 93 |
| 22 High: M Low: M Rain: | 23 | 24 | 25 | 26 | 27 | 28 |
| 29 | 30 | 01 | 02 | 03 | 04 | 05 |
The data presented here provided by IEM API webservice: daily.json. A simple CSV option exists as well.
Daily High/Low Plot
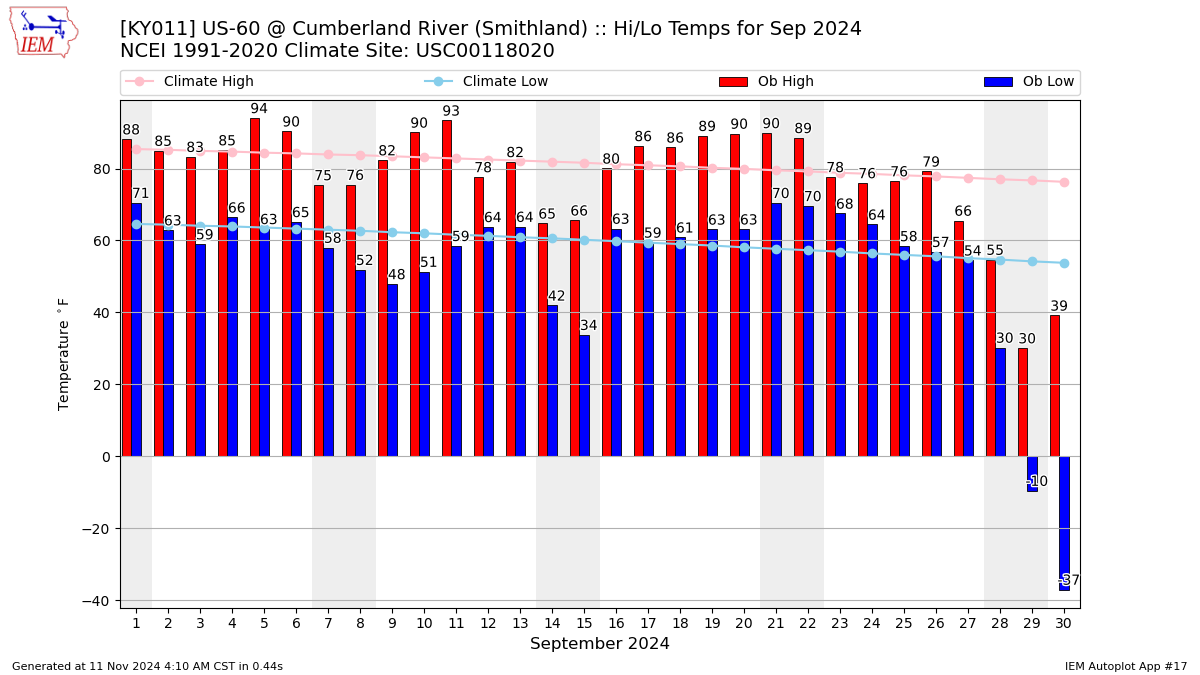
Description: This chart of the monthly temperature data. The bars are the observations and the dots are climatology.
Daily Rainfall

Description: This chart is of daily precipitation for the month. The red line would be an average month while the blue line and bars are observations.
Daily Average Wind Speeds
Description: This chart is of the daily average wind speeds.
The data presented here provided by IEM API webservice: daily.json. A simple CSV option exists as well.