Information Last Ob Photographs Meteogram Network Table Neighbors Monthly Summaries Observation History Wind Roses Custom Wind Roses Data Calendar
| Aug 2024 | Sep 2024 | Oct 2024 | ||||
|---|---|---|---|---|---|---|
| Sunday | Monday | Tuesday | Wednesday | Thursday | Friday | Saturday |
| 01 High: 83.080376 Low: 70.10058 Rain: RH% Min/Max: 70-99 Feel Min/Max: 70 to 88 | 02 High: 78.18981 Low: 59.10079 Rain: RH% Min/Max: 40-99 Feel Min/Max: 59 to 78 | 03 High: 74.91918 Low: 48.239594 Rain: RH% Min/Max: 35-95 Feel Min/Max: 48 to 75 | 04 High: 80.549614 Low: 49.56081 Rain: RH% Min/Max: 44-99 Feel Min/Max: 50 to 81 | 05 High: 79.98981 Low: 52.21939 Rain: RH% Min/Max: 41-100 Feel Min/Max: 52 to 80 | 06 High: 79.48043 Low: 53.99962 Rain: RH% Min/Max: 61-99 Feel Min/Max: 54 to 79 | 07 High: 73.39999 Low: 55.9292 Rain: RH% Min/Max: 66-100 Feel Min/Max: 56 to 73 |
| 08 High: 69.74962 Low: 48.529415 Rain: RH% Min/Max: 41-100 Feel Min/Max: 49 to 70 | 09 High: 75.39983 Low: 47.100204 Rain: RH% Min/Max: 48-96 Feel Min/Max: 47 to 75 | 10 High: 77.01081 Low: 54.420776 Rain: RH% Min/Max: 34-98 Feel Min/Max: 54 to 77 | 11 High: 78.67941 Low: 48.21982 Rain: RH% Min/Max: 36-98 Feel Min/Max: 48 to 79 | 12 High: 80.9204 Low: 50.160225 Rain: RH% Min/Max: 42-99 Feel Min/Max: 50 to 81 | 13 High: 84.3098 Low: 53.40921 Rain: RH% Min/Max: 48-100 Feel Min/Max: 53 to 85 | 14 High: 86.210594 Low: 59.610226 Rain: RH% Min/Max: 47-99 Feel Min/Max: 60 to 88 |
| 15 High: 82.34962 Low: 57.180214 Rain: RH% Min/Max: 47-100 Feel Min/Max: 57 to 83 | 16 High: 83.28922 Low: 51.09082 Rain: RH% Min/Max: 33-100 Feel Min/Max: 51 to 82 | 17 High: 82.29919 Low: 56.74999 Rain: RH% Min/Max: 29-100 Feel Min/Max: 57 to 81 | 18 High: 74.03 Low: 54.96081 Rain: RH% Min/Max: 67-100 Feel Min/Max: 55 to 74 | 19 High: 84.95058 Low: 59.79018 Rain: RH% Min/Max: 39-97 Feel Min/Max: 60 to 84 | 20 High: 72.75921 Low: 64.49002 Rain: RH% Min/Max: 69-91 Feel Min/Max: 64 to 73 | 21 High: 69.96023 Low: 60.34999 Rain: RH% Min/Max: 60-82 Feel Min/Max: 60 to 70 |
| 22 High: 59.970192 Low: 58.060383 Rain: RH% Min/Max: 82-86 Feel Min/Max: 58 to 60 | 23 High: M Low: M Rain: | 24 | 25 | 26 | 27 | 28 |
| 29 | 30 | 01 | 02 | 03 | 04 | 05 |
The data presented here provided by IEM API webservice: daily.json. A simple CSV option exists as well.
Daily High/Low Plot
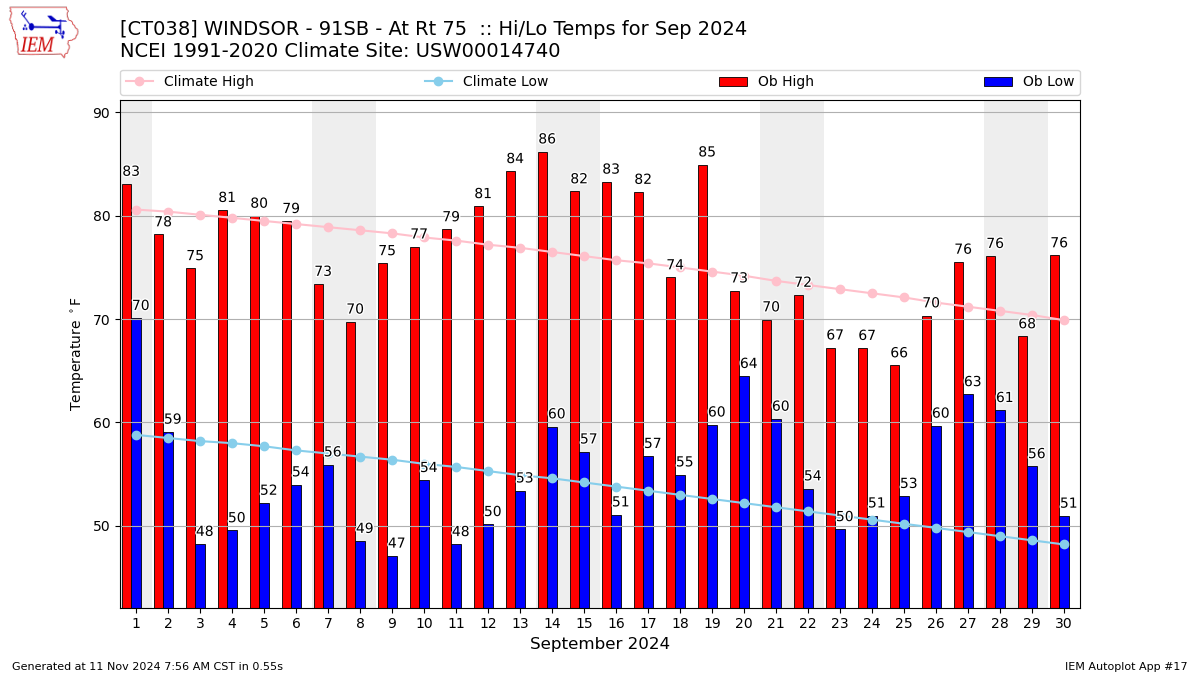
Description: This chart of the monthly temperature data. The bars are the observations and the dots are climatology.
Daily Rainfall

Description: This chart is of daily precipitation for the month. The red line would be an average month while the blue line and bars are observations.
Daily Average Wind Speeds
Description: This chart is of the daily average wind speeds.
The data presented here provided by IEM API webservice: daily.json. A simple CSV option exists as well.