IEM Daily Feature
Tuesday, 08 November 2022
Tuesday, 08 November 2022
90 Day SPI Changes
Posted: 08 Nov 2022 05:30 AM
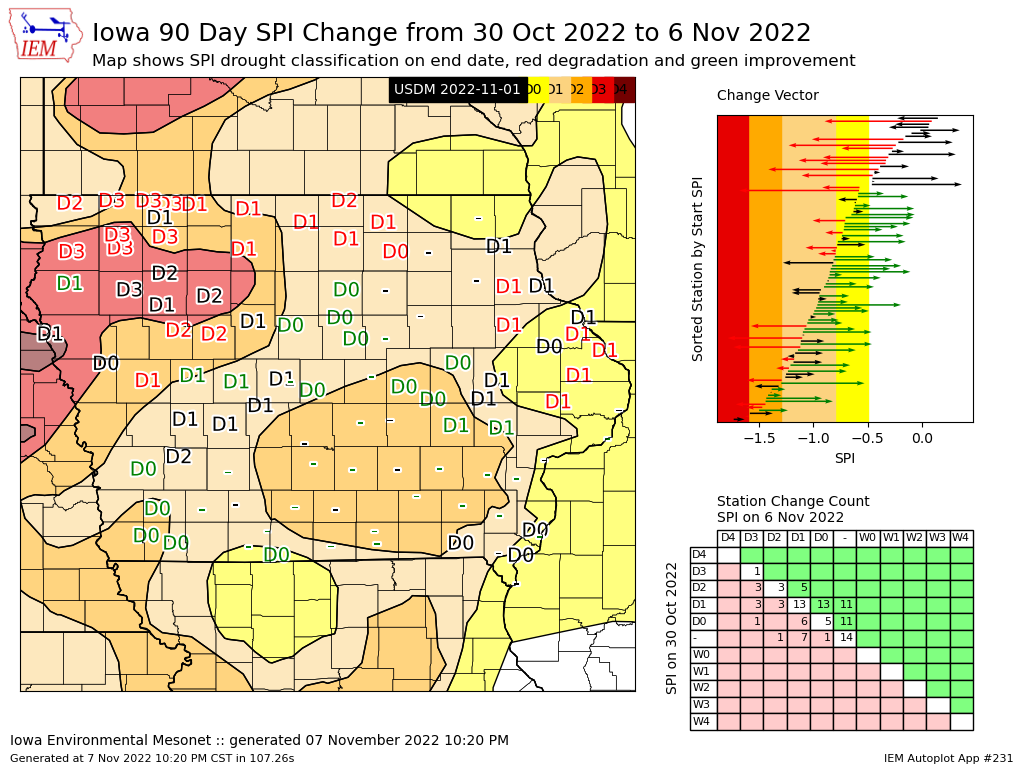
A current question is how the rainfall event over this past weekend changed the drought situation over
the state. The featured map evaluates the change in trailing 90 day SPI from 30 October till 6
November. The point labels on the map indicate locations that had drought classification changes by
this 90 day SPI metric. Please note that the drought monitor is not a single SPI value, but a
combination of many SPI values, impacts and other factors. So of interest is the degradation shown
around the Dubuque area. How could this be as the area generally saw two to three inches of rainfall
over the past seven days! Well, one needs to consider how this trailing 90 day window changes the
precipitation totals. This area had a significant rainfall event on 7 August, which gets included in the 30
Oct value and not in the 6 November value. So the net effect is a decrease in 90 day precipitation and
thus a decrease in SPI! The top right plot shows the change in station SPI and there's a massive red
arrow that is one of these eastern Iowa stations that had a huge rainfall on 7 August get pulled out of
the 90 day SPI evalulated on 6 November. Fun times in drought metrics land here.
Voting:
Good = 8
Bad = 0
Voting:
Good = 8
Bad = 0