IEM Daily Feature
Thursday, 17 December 2015
Thursday, 17 December 2015
December and SOI
Posted: 17 Dec 2015 05:36 AM
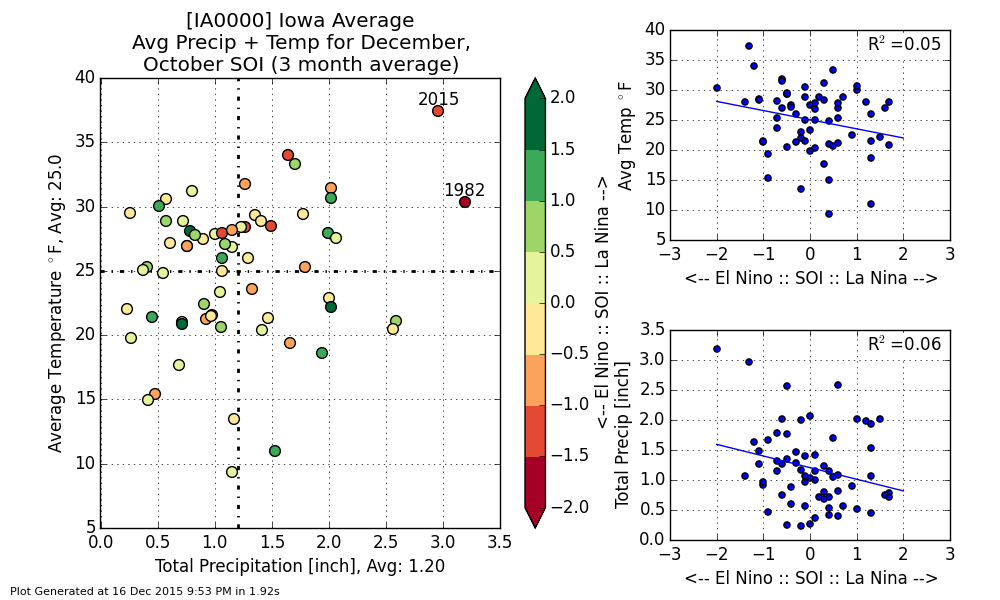
The featured chart displays the combination of Iowa averaged temperature and
precipitation for each December since 1893. The month to date data for 2015 is shown as
well. The chart also includes the three month averaged Southern Oscillation Index (SOI)
valid for October to compare with each December of the same year. Having an
exceptionally wet and warm December along with an exceptionally strong El Nino makes
one wonder if the two are related? The answer is that it is complicated, but another strong
El Nino year of 1982 shows up prominently on this chart along with 2015. There is no
simple relationship between El Nino and our weather, but a complex interaction between
atmospheric flow at varying scales. You can generate this chart on the website and explore
these relationships more.
Voting:
Good = 16
Bad = 7
Abstain = 3
Voting:
Good = 16
Bad = 7
Abstain = 3