Information Last Ob Photographs Meteogram Network Table Neighbors Monthly Summaries Observation History Wind Roses Custom Wind Roses Data Calendar
| Jan 2025 | Feb 2025 | Mar 2025 | ||||
|---|---|---|---|---|---|---|
| Sunday | Monday | Tuesday | Wednesday | Thursday | Friday | Saturday |
| 26 | 27 | 28 | 29 | 30 | 31 | 01 High: 51.26001 Low: 31.28 Precip: M RH% Min/Max: 30-63 Feel Min/Max: 31 to 51 |
| 02 High: 46.040024 Low: 21.56001 Precip: M RH% Min/Max: 40-88 Feel Min/Max: 22 to 46 | 03 High: 22.819979 Low: 2.48 Precip: M RH% Min/Max: 50-93 Feel Min/Max: 2 to 23 | 04 High: 11.299989 Low: 1.399989 Precip: M RH% Min/Max: 35-77 Feel Min/Max: 1 to 11 | 05 High: 23.36001 Low: 7.160011 Precip: M RH% Min/Max: 46-79 Feel Min/Max: 7 to 23 | 06 High: 42.08 Low: 8.78 Precip: M RH% Min/Max: 12-69 Feel Min/Max: 9 to 42 | 07 High: 40.28 Low: 9.319978 Precip: M RH% Min/Max: 22-76 Feel Min/Max: 9 to 40 | 08 High: 20.660011 Low: 4.099989 Precip: M RH% Min/Max: 42-77 Feel Min/Max: 4 to 21 |
| 09 High: 35.24002 Low: 2.299989 Precip: M RH% Min/Max: 23-81 Feel Min/Max: 2 to 35 | 10 High: 18.68 Low: 1.0399945 Precip: M RH% Min/Max: 53-78 Feel Min/Max: 1 to 19 | 11 High: 1.0399945 Low: -5.0799947 Precip: M RH% Min/Max: 71-79 Feel Min/Max: -5 to 1 | 12 High: 4.999989 Low: -17.679995 Precip: M RH% Min/Max: 48-79 Feel Min/Max: -18 to 5 | 13 High: 21.56001 Low: -19.479994 Precip: M RH% Min/Max: 40-77 Feel Min/Max: -19 to 22 | 14 High: 29.29999 Low: 11.660011 Precip: M RH% Min/Max: 57-80 Feel Min/Max: 12 to 29 | 15 High: 16.160011 Low: -3.639989 Precip: M RH% Min/Max: 62-88 Feel Min/Max: -4 to 16 |
| 16 High: 12.919978 Low: -10.300011 Precip: M RH% Min/Max: 48-79 Feel Min/Max: -10 to 13 | 17 High: 3.199989 Low: -14.079994 Precip: M RH% Min/Max: 67-80 Feel Min/Max: -14 to 3 | 18 High: -9.579994 Low: -16.239988 Precip: M RH% Min/Max: 72-74 Feel Min/Max: -16 to -10 | 19 High: -5.9799943 Low: -25.600012 Precip: M RH% Min/Max: 57-74 Feel Min/Max: -26 to -6 | 20 High: 5.360011 Low: -29.379995 Precip: M RH% Min/Max: 46-76 Feel Min/Max: -29 to 5 | 21 High: 23.18 Low: -1.8399891 Precip: M RH% Min/Max: 52-78 Feel Min/Max: -2 to 23 | 22 High: 47.11998 Low: 4.640022 Precip: M RH% Min/Max: 33-85 Feel Min/Max: 5 to 47 |
| 23 High: 58.640022 Low: 21.019978 Precip: M RH% Min/Max: 21-89 Feel Min/Max: 21 to 59 | 24 High: 60.44002 Low: 25.88 Precip: M RH% Min/Max: 19-86 Feel Min/Max: 26 to 60 | 25 High: 67.81998 Low: 22.819979 Precip: M Avg Wind: N @ 0.0 RH% Min/Max: 8-80 Feel Min/Max: 23 to 68 | 26 High: 50.18 Low: 24.260012 Precip: M Avg Wind: N @ 0.0 RH% Min/Max: 25-79 Feel Min/Max: 24 to 50 | 27 High: 53.96001 Low: 20.660011 Precip: M RH% Min/Max: 20-84 Feel Min/Max: 21 to 54 | 28 Precip: M | 01 |
The data presented here provided by IEM API webservice: daily.json. A simple CSV option exists as well.
Daily High/Low Plot
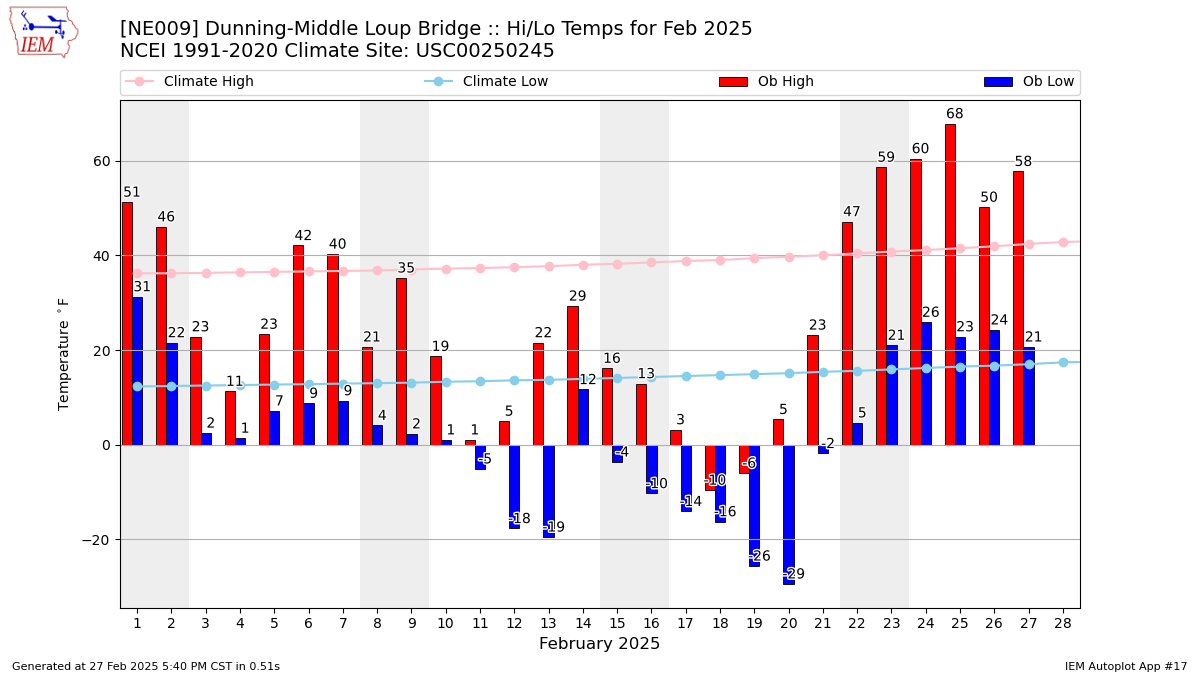
Description: This chart of the monthly temperature data. The bars are the observations and the dots are climatology.
Daily Rainfall

Description: This chart is of daily precipitation for the month. The red line would be an average month while the blue line and bars are observations.
Daily Average Wind Speeds

Description: This chart is of the daily average wind speeds.
The data presented here provided by IEM API webservice: daily.json. A simple CSV option exists as well.