Information Last Ob Photographs Meteogram Network Table Neighbors Monthly Summaries Observation History Wind Roses Custom Wind Roses Data Calendar
| Jan 2025 | Feb 2025 | Mar 2025 | ||||
|---|---|---|---|---|---|---|
| Sunday | Monday | Tuesday | Wednesday | Thursday | Friday | Saturday |
| 26 | 27 | 28 | 29 | 30 | 31 | 01 High: 54.150787 Low: 30.520405 Precip: M Gust: 12 (10:20 AM) RH% Min/Max: 45-98 Feel Min/Max: 27 to 54 |
| 02 High: 37.470192 Low: 25.640608 Precip: M Gust: 10 (2:19 AM) RH% Min/Max: 47-77 Feel Min/Max: 21 to 37 | 03 High: 55.990395 Low: 30.99919 Precip: M Gust: 13 (11:59 PM) RH% Min/Max: 67-90 Feel Min/Max: 31 to 56 | 04 High: 65.89941 Low: 38.04082 Precip: M Gust: 19 (3:40 PM) RH% Min/Max: 37-74 Feel Min/Max: 37 to 66 | 05 High: 38.24061 Low: 32.840607 Precip: M Gust: 9 (11:59 PM) RH% Min/Max: 45-84 Feel Min/Max: 30 to 38 | 06 High: 47.980427 Low: 32.34919 Precip: M Gust: 16 (2:00 PM) RH% Min/Max: 84-93 Feel Min/Max: 29 to 47 | 07 High: 54.820404 Low: 35.94018 Precip: M Gust: 17 (12:20 PM) RH% Min/Max: 33-90 Feel Min/Max: 36 to 55 | 08 High: 35.78 Low: 32.399616 Precip: M Gust: 9 (12:59 PM) RH% Min/Max: 48-92 Feel Min/Max: 30 to 36 |
| 09 High: 49.749775 Low: 33.929573 Precip: M Gust: 15 (1:19 PM) RH% Min/Max: 47-93 Feel Min/Max: 34 to 50 | 10 High: 41.439224 Low: 28.599775 Precip: M Gust: 10 (12:19 PM) RH% Min/Max: 51-72 Feel Min/Max: 29 to 41 | 11 High: 35.220192 Low: 27.120192 Precip: M Gust: 8 (7:59 AM) RH% Min/Max: 52-91 Feel Min/Max: 27 to 35 | 12 High: 36.46939 Low: 31.110811 Precip: M Gust: 9 (1:19 PM) RH% Min/Max: 89-94 Feel Min/Max: 31 to 36 | 13 High: 50.039597 Low: 35.000576 Precip: M Gust: 19 (5:49 PM) RH% Min/Max: 54-95 Feel Min/Max: 33 to 50 | 14 High: 43.829628 Low: 29.150576 Precip: M Gust: 12 (10:59 AM) RH% Min/Max: 30-72 Feel Min/Max: 29 to 44 | 15 High: 41.860382 Low: 31.749775 Precip: M Gust: 12 (10:59 PM) RH% Min/Max: 55-93 Feel Min/Max: 32 to 42 |
| 16 High: 64.6808 Low: 38.1308 Precip: M Gust: 31 (2:40 PM) RH% Min/Max: 48-97 Feel Min/Max: 34 to 65 | 17 High: 43.66939 Low: 31.139595 Precip: M Gust: 29 (11:39 AM) RH% Min/Max: 30-59 Feel Min/Max: 25 to 42 | 18 High: 34.610012 Low: 22.069391 Precip: M Gust: 15 (2:39 PM) RH% Min/Max: 28-46 Feel Min/Max: 19 to 35 | 19 High: 24.47062 Low: 19.500788 Precip: M Gust: 9 (1:19 AM) RH% Min/Max: 39-75 Feel Min/Max: 17 to 24 | 20 High: 29.850788 Low: 19.650202 Precip: M Gust: 18 (4:39 PM) RH% Min/Max: 44-74 Feel Min/Max: 18 to 28 | 21 High: 41.050415 Low: 24.000788 Precip: M Gust: 17 (3:49 PM) RH% Min/Max: 34-59 Feel Min/Max: 20 to 41 | 22 High: 37.599777 Low: 21.869606 Precip: M Gust: 11 (2:59 PM) RH% Min/Max: 46-77 Feel Min/Max: 22 to 37 |
| 23 High: 50.91982 Low: 27.86001 Precip: M Gust: 14 (12:19 PM) RH% Min/Max: 28-73 Feel Min/Max: 28 to 51 | 24 High: 49.339382 Low: 29.240608 Precip: M Gust: 21 (4:09 PM) RH% Min/Max: 49-79 Feel Min/Max: 29 to 48 | 25 High: 66.63021 Low: 37.56918 Precip: M Avg Wind: S @ 1.5 Gust: 15 (4:20 AM) RH% Min/Max: 31-84 Feel Min/Max: 38 to 67 | 26 High: 61.05921 Low: 38.390022 Precip: M Gust: 15 (4:59 PM) RH% Min/Max: 44-77 Feel Min/Max: 38 to 61 | 27 Precip: M | 28 | 01 |
The data presented here provided by IEM API webservice: daily.json. A simple CSV option exists as well.
Daily High/Low Plot
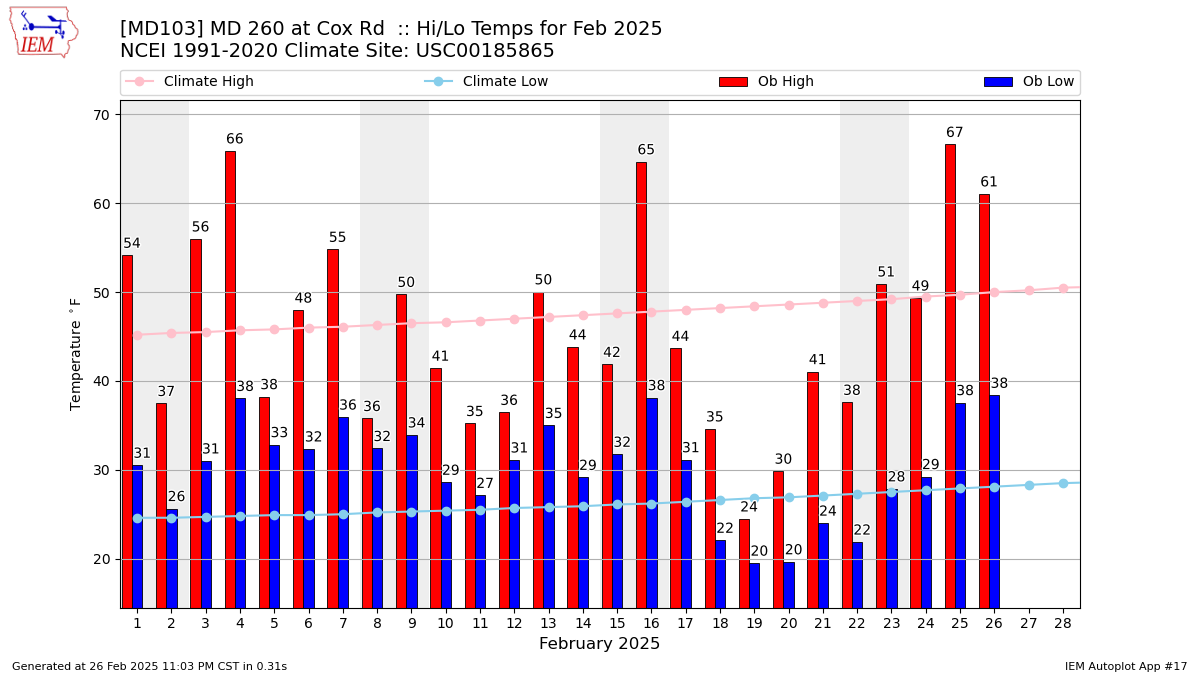
Description: This chart of the monthly temperature data. The bars are the observations and the dots are climatology.
Daily Rainfall
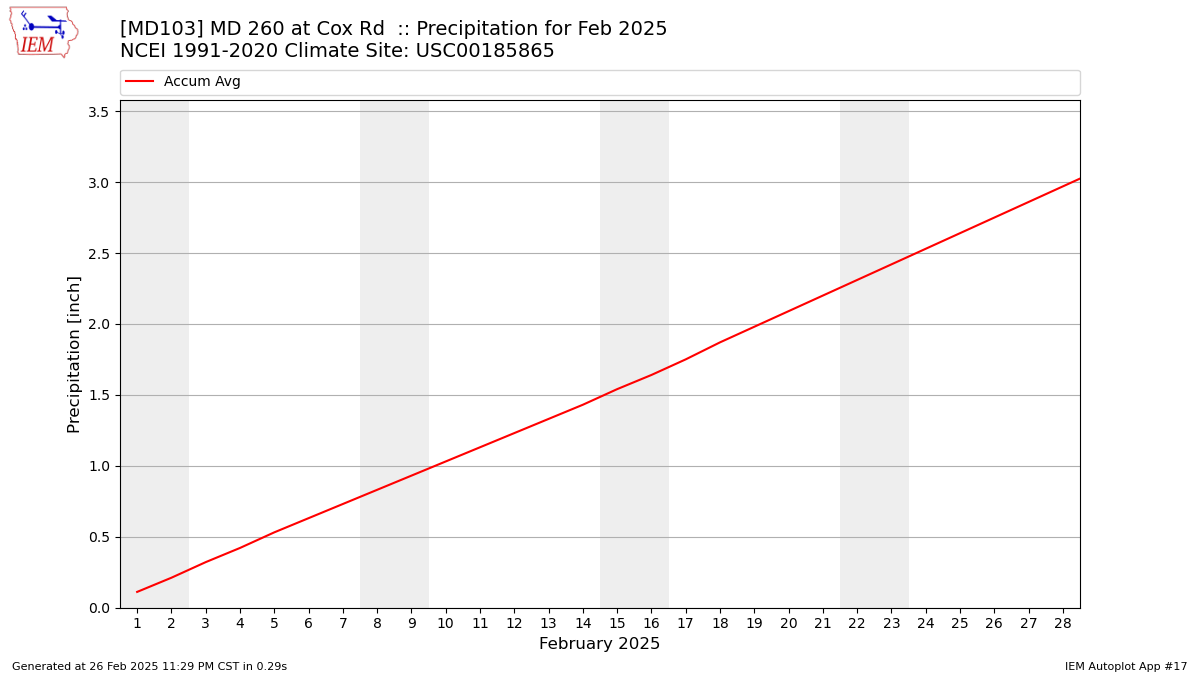
Description: This chart is of daily precipitation for the month. The red line would be an average month while the blue line and bars are observations.
Daily Average Wind Speeds
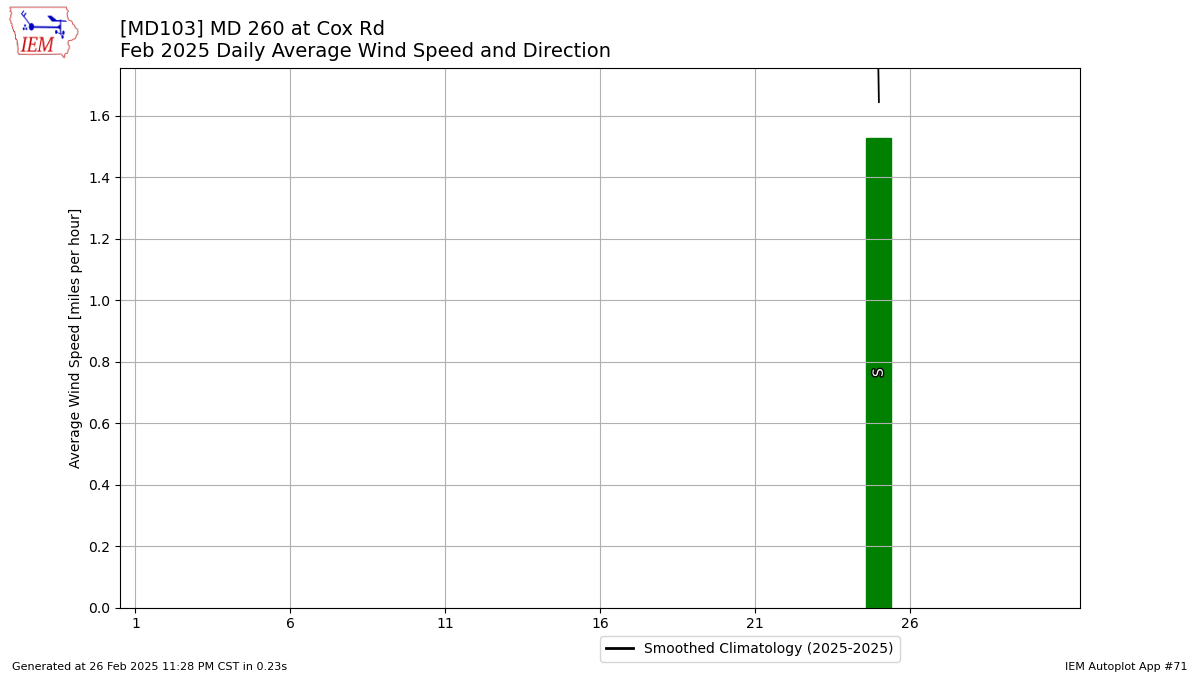
Description: This chart is of the daily average wind speeds.
The data presented here provided by IEM API webservice: daily.json. A simple CSV option exists as well.