Information Last Ob Photographs Meteogram Network Table Neighbors Monthly Summaries Observation History Wind Roses Custom Wind Roses Data Calendar
| Jan 2025 | Feb 2025 | Mar 2025 | ||||
|---|---|---|---|---|---|---|
| Sunday | Monday | Tuesday | Wednesday | Thursday | Friday | Saturday |
| 26 | 27 | 28 | 29 | 30 | 31 | 01 High: 54.429787 Low: 27.730427 Precip: M Gust: 34 (8:20 AM) RH% Min/Max: 29-92 Feel Min/Max: 21 to 54 |
| 02 High: 40.920776 Low: 21.180214 Precip: M Gust: 20 (9:20 AM) RH% Min/Max: 44-76 Feel Min/Max: 14 to 41 | 03 High: 57.36918 Low: 29.510597 Precip: M Gust: 19 (10:39 PM) RH% Min/Max: 54-86 Feel Min/Max: 30 to 57 | 04 High: 55.59082 Low: 34.77019 Precip: M Gust: 30 (12:40 PM) RH% Min/Max: 42-75 Feel Min/Max: 33 to 56 | 05 High: 38.289223 Low: 32.489594 Precip: M Gust: 11 (8:39 AM) RH% Min/Max: 44-74 Feel Min/Max: 28 to 38 | 06 High: 44.000576 Low: 31.179201 Precip: M Gust: 15 (2:19 PM) RH% Min/Max: 76-90 Feel Min/Max: 24 to 43 | 07 High: 46.889595 Low: 33.859425 Precip: M Gust: 35 (9:20 AM) RH% Min/Max: 41-90 Feel Min/Max: 30 to 43 | 08 High: 36.41001 Low: 28.349617 Precip: M Gust: 13 (1:19 PM) RH% Min/Max: 47-88 Feel Min/Max: 25 to 36 |
| 09 High: 44.99061 Low: 33.589382 Precip: M Gust: 32 (10:59 AM) RH% Min/Max: 53-90 Feel Min/Max: 28 to 40 | 10 High: 41.430214 Low: 28.119179 Precip: M Gust: 17 (12:39 PM) RH% Min/Max: 45-70 Feel Min/Max: 22 to 37 | 11 High: 38.159584 Low: 25.93938 Precip: M Gust: 12 (8:19 PM) RH% Min/Max: 49-86 Feel Min/Max: 22 to 35 | 12 High: 36.91939 Low: 31.029787 Precip: M Gust: 18 (7:59 PM) RH% Min/Max: 83-93 Feel Min/Max: 27 to 35 | 13 High: 46.839222 Low: 35.119392 Precip: M Gust: 39 (7:39 PM) RH% Min/Max: 55-96 Feel Min/Max: 27 to 44 | 14 High: 38.899403 Low: 28.399988 Precip: M Gust: 26 (10:59 AM) RH% Min/Max: 38-62 Feel Min/Max: 22 to 36 | 15 High: 40.549988 Low: 29.220778 Precip: M Gust: 18 (10:39 AM) RH% Min/Max: 52-91 Feel Min/Max: 25 to 39 |
| 16 High: 61.88 Low: 36.669178 Precip: M Gust: 43 (5:39 PM) RH% Min/Max: 55-97 Feel Min/Max: 26 to 62 | 17 High: 38.260384 Low: 30.860598 Precip: M Gust: 44 (1:19 AM) RH% Min/Max: 39-56 Feel Min/Max: 16 to 29 | 18 High: 31.179201 Low: 20.76982 Precip: M Gust: 30 (1:59 AM) RH% Min/Max: 34-45 Feel Min/Max: 9 to 22 | 19 High: 25.050203 Low: 17.769178 Precip: M Gust: 22 (2:39 AM) RH% Min/Max: 44-76 Feel Min/Max: 5 to 25 | 20 High: 26.470406 Low: 17.799776 Precip: M Gust: 30 (4:59 PM) RH% Min/Max: 49-75 Feel Min/Max: 10 to 18 | 21 High: 36.359585 Low: 24.510225 Precip: M Gust: 35 (10:19 AM) RH% Min/Max: 39-59 Feel Min/Max: 10 to 27 | 22 High: 40.02078 Low: 17.749403 Precip: M Gust: 14 (2:39 PM) RH% Min/Max: 41-70 Feel Min/Max: 15 to 35 |
| 23 High: 48.9308 Low: 24.679415 Precip: M Gust: 18 (11:19 AM) RH% Min/Max: 32-80 Feel Min/Max: 21 to 49 | 24 High: 56.04082 Low: 29.809425 Precip: M Gust: 23 (1:19 PM) RH% Min/Max: 34-72 Feel Min/Max: 30 to 56 | 25 High: 61.460598 Low: 35.909584 Precip: M Avg Wind: SW @ 4.2 Gust: 15 (1:59 PM) RH% Min/Max: 38-73 Feel Min/Max: 36 to 61 | 26 High: 64.16961 Low: 31.609425 Precip: M Gust: 19 (10:29 AM) RH% Min/Max: 36-81 Feel Min/Max: 32 to 64 | 27 Precip: M | 28 | 01 |
The data presented here provided by IEM API webservice: daily.json. A simple CSV option exists as well.
Daily High/Low Plot

Description: This chart of the monthly temperature data. The bars are the observations and the dots are climatology.
Daily Rainfall
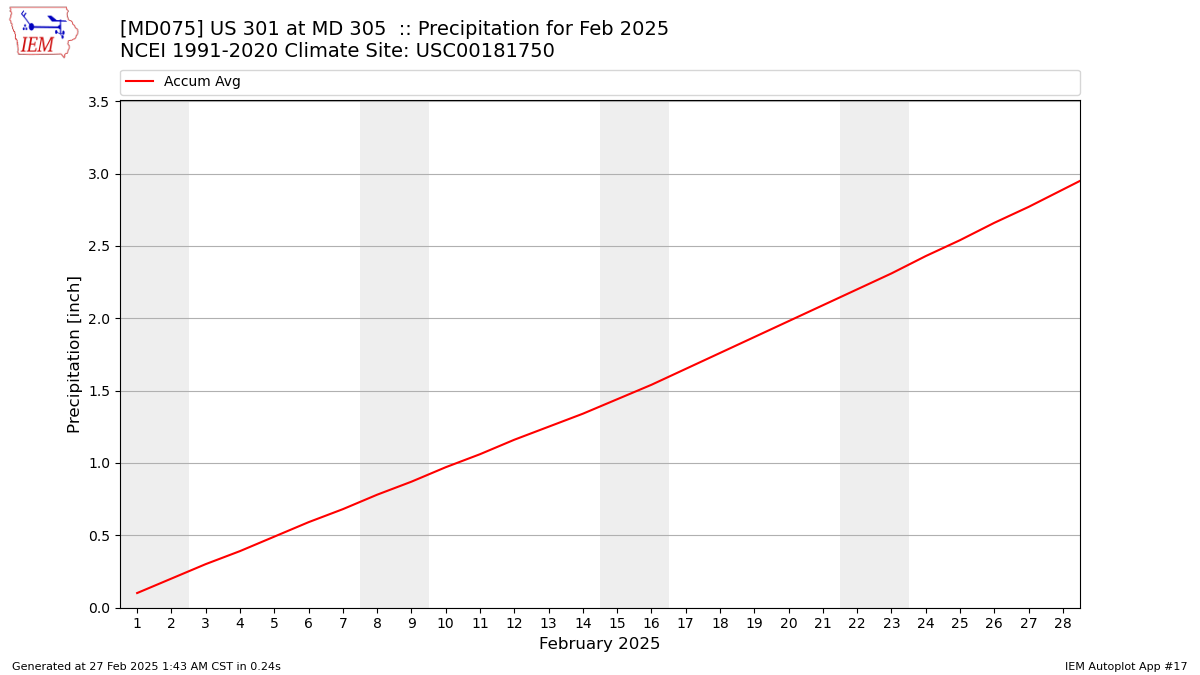
Description: This chart is of daily precipitation for the month. The red line would be an average month while the blue line and bars are observations.
Daily Average Wind Speeds

Description: This chart is of the daily average wind speeds.
The data presented here provided by IEM API webservice: daily.json. A simple CSV option exists as well.