Information Last Ob Photographs Meteogram Network Table Neighbors Monthly Summaries Observation History Wind Roses Custom Wind Roses Data Calendar
| Jan 2025 | Feb 2025 | Mar 2025 | ||||
|---|---|---|---|---|---|---|
| Sunday | Monday | Tuesday | Wednesday | Thursday | Friday | Saturday |
| 26 | 27 | 28 | 29 | 30 | 31 | 01 High: 53.810596 Low: 29.64018 Precip: M Gust: 33 (9:39 AM) RH% Min/Max: 31-100 Feel Min/Max: 24 to 54 |
| 02 High: 45.489223 Low: 24.360811 Precip: M Gust: 13 (9:39 AM) RH% Min/Max: 50-80 Feel Min/Max: 19 to 45 | 03 High: 55.320778 Low: 36.06081 Precip: M Gust: 18 (9:59 PM) RH% Min/Max: 60-85 Feel Min/Max: 36 to 55 | 04 High: 61.950203 Low: 39.790394 Precip: M Gust: 30 (4:50 PM) RH% Min/Max: 46-87 Feel Min/Max: 35 to 62 | 05 High: 40.80921 Low: 31.269178 Precip: M Gust: 14 (7:59 PM) RH% Min/Max: 47-86 Feel Min/Max: 28 to 41 | 06 High: 44.839382 Low: 32.680428 Precip: M Gust: 22 (3:19 PM) RH% Min/Max: 88-94 Feel Min/Max: 26 to 42 | 07 High: 51.09082 Low: 35.589222 Precip: M Gust: 26 (10:19 AM) RH% Min/Max: 40-94 Feel Min/Max: 36 to 51 | 08 High: 37.340607 Low: 29.010225 Precip: M Gust: 15 (1:49 PM) RH% Min/Max: 54-94 Feel Min/Max: 25 to 37 |
| 09 High: 47.330585 Low: 36.5792 Precip: M Gust: 28 (11:20 AM) RH% Min/Max: 53-95 Feel Min/Max: 31 to 42 | 10 High: 44.49018 Low: 29.330585 Precip: M Gust: 17 (11:19 AM) RH% Min/Max: 45-75 Feel Min/Max: 26 to 42 | 11 High: 40.609425 Low: 28.700575 Precip: M Gust: 12 (9:39 PM) RH% Min/Max: 45-90 Feel Min/Max: 27 to 39 | 12 High: 40.19002 Low: 32.41939 Precip: M Gust: 18 (2:19 AM) RH% Min/Max: 88-94 Feel Min/Max: 26 to 40 | 13 High: 45.96081 Low: 36.800575 Precip: M Gust: 28 (10:39 PM) RH% Min/Max: 54-96 Feel Min/Max: 29 to 43 | 14 High: 41.190823 Low: 29.94082 Precip: M Gust: 26 (9:40 AM) RH% Min/Max: 36-76 Feel Min/Max: 25 to 40 | 15 High: 52.860226 Low: 30.54018 Precip: M Gust: 29 (9:20 PM) RH% Min/Max: 51-96 Feel Min/Max: 27 to 53 |
| 16 High: 63.46939 Low: 38.530373 Precip: M Gust: 47 (11:59 AM) RH% Min/Max: 52-99 Feel Min/Max: 31 to 63 | 17 High: 42.499405 Low: 32.610226 Precip: M Gust: 41 (4:59 AM) RH% Min/Max: 37-58 Feel Min/Max: 21 to 37 | 18 High: 34.140182 Low: 25.14018 Precip: M Gust: 26 (1:50 PM) RH% Min/Max: 30-48 Feel Min/Max: 15 to 32 | 19 High: 26.310225 Low: 20.870619 Precip: M Gust: 19 (1:19 AM) RH% Min/Max: 44-85 Feel Min/Max: 10 to 26 | 20 High: 28.700575 Low: 22.499617 Precip: M Gust: 30 (11:39 PM) RH% Min/Max: 48-81 Feel Min/Max: 12 to 24 | 21 High: 38.10921 Low: 24.79999 Precip: M Gust: 28 (11:49 AM) RH% Min/Max: 39-59 Feel Min/Max: 13 to 32 | 22 High: 40.960384 Low: 21.889381 Precip: M Gust: 16 (3:19 PM) RH% Min/Max: 43-80 Feel Min/Max: 21 to 37 |
| 23 High: 50.500416 Low: 27.350574 Precip: M Gust: 20 (10:19 AM) RH% Min/Max: 30-86 Feel Min/Max: 22 to 51 | 24 High: 54.030212 Low: 30.21081 Precip: M Gust: 22 (1:50 PM) RH% Min/Max: 37-80 Feel Min/Max: 27 to 54 | 25 High: 64.38021 Low: 40.249405 Precip: M Avg Wind: SW @ 6.4 Gust: 22 (1:19 PM) RH% Min/Max: 38-78 Feel Min/Max: 36 to 64 | 26 High: 62.299404 Low: 34.069977 Precip: M Gust: 18 (1:49 PM) RH% Min/Max: 45-86 Feel Min/Max: 32 to 62 | 27 Precip: M | 28 | 01 |
The data presented here provided by IEM API webservice: daily.json. A simple CSV option exists as well.
Daily High/Low Plot
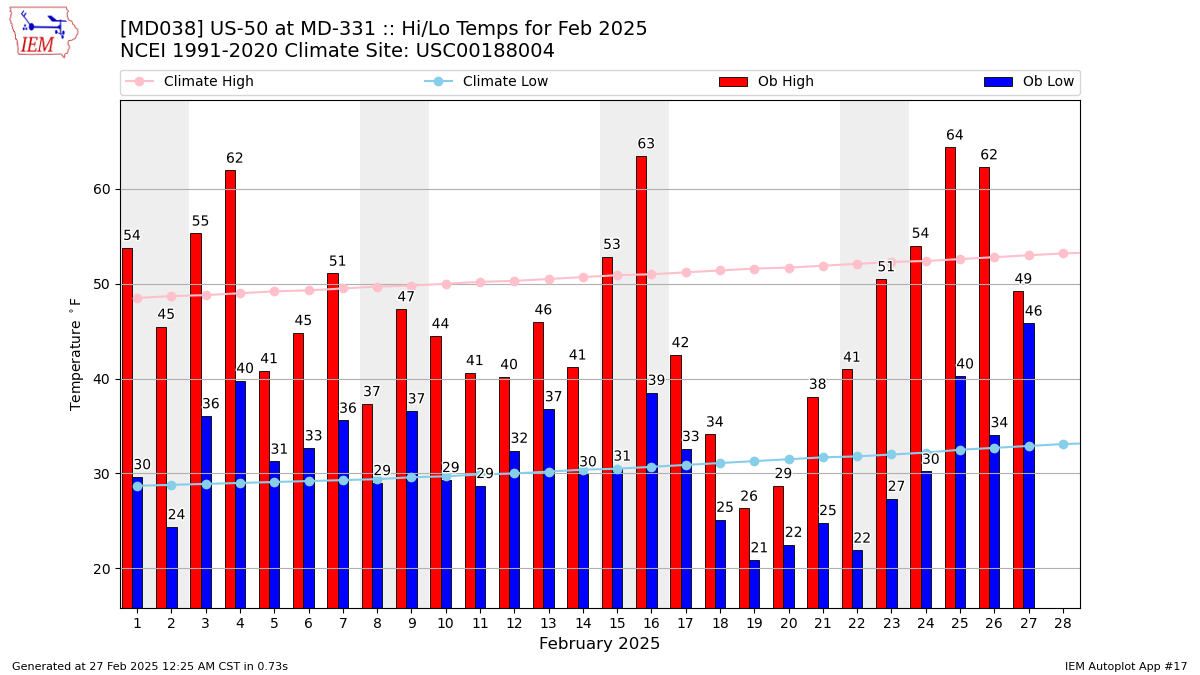
Description: This chart of the monthly temperature data. The bars are the observations and the dots are climatology.
Daily Rainfall

Description: This chart is of daily precipitation for the month. The red line would be an average month while the blue line and bars are observations.
Daily Average Wind Speeds
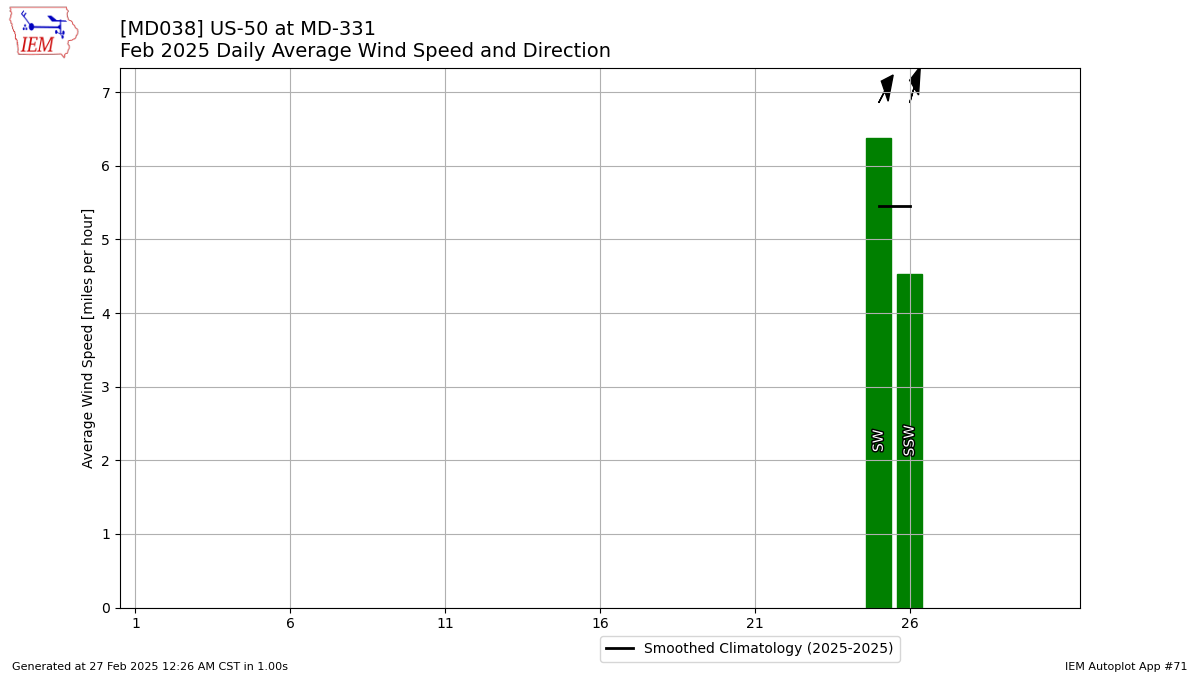
Description: This chart is of the daily average wind speeds.
The data presented here provided by IEM API webservice: daily.json. A simple CSV option exists as well.