Information Last Ob Photographs Meteogram Network Table Neighbors Monthly Summaries Observation History Wind Roses Custom Wind Roses Data Calendar
| Jan 2025 | Feb 2025 | Mar 2025 | ||||
|---|---|---|---|---|---|---|
| Sunday | Monday | Tuesday | Wednesday | Thursday | Friday | Saturday |
| 26 | 27 | 28 | 29 | 30 | 31 | 01 High: 50.329414 Low: 22.470778 Precip: M Gust: 28 (9:19 AM) RH% Min/Max: 36-100 Feel Min/Max: 15 to 50 |
| 02 High: 32.059425 Low: 15.839595 Precip: M Gust: 17 (3:20 PM) RH% Min/Max: 57-93 Feel Min/Max: 12 to 31 | 03 High: 50.46081 Low: 29.820192 Precip: M Gust: 20 (11:40 PM) RH% Min/Max: 74-93 Feel Min/Max: 24 to 50 | 04 High: 54.78981 Low: 29.40079 Precip: M Gust: 33 (1:19 PM) RH% Min/Max: 47-87 Feel Min/Max: 23 to 55 | 05 High: 34.170776 Low: 27.559425 Precip: M Gust: 16 (4:39 AM) RH% Min/Max: 51-78 Feel Min/Max: 19 to 34 | 06 High: 41.779415 Low: 27.710596 Precip: M Gust: 21 (3:59 AM) RH% Min/Max: 80-100 Feel Min/Max: 21 to 38 | 07 High: 45.359585 Low: 28.259584 Precip: M Gust: 35 (6:00 AM) RH% Min/Max: 49-100 Feel Min/Max: 23 to 41 | 08 High: 30.680586 Low: 26.149988 Precip: M Gust: 19 (8:20 PM) RH% Min/Max: 61-100 Feel Min/Max: 19 to 31 |
| 09 High: 37.11918 Low: 29.539381 Precip: M Gust: 38 (10:49 AM) RH% Min/Max: 67-100 Feel Min/Max: 24 to 31 | 10 High: 37.38922 Low: 26.220192 Precip: M Gust: 22 (4:00 PM) RH% Min/Max: 51-81 Feel Min/Max: 21 to 31 | 11 High: 30.83 Low: 25.44082 Precip: M Gust: 11 (12:39 PM) RH% Min/Max: 61-100 Feel Min/Max: 20 to 31 | 12 High: 32.63 Low: 25.44082 Precip: M Gust: 12 (11:39 PM) RH% Min/Max: 100-100 Feel Min/Max: 19 to 33 | 13 High: 47.089382 Low: 30.360224 Precip: M Gust: 41 (3:39 PM) RH% Min/Max: 67-100 Feel Min/Max: 21 to 42 | 14 High: 34.030373 Low: 23.889223 Precip: M Gust: 28 (1:20 AM) RH% Min/Max: 46-80 Feel Min/Max: 14 to 30 | 15 High: 32.910812 Low: 26.279573 Precip: M Gust: 20 (8:59 AM) RH% Min/Max: 58-100 Feel Min/Max: 20 to 33 |
| 16 High: 51.290607 Low: 30.799402 Precip: M Gust: 53 (7:19 PM) RH% Min/Max: 68-100 Feel Min/Max: 20 to 51 | 17 High: 32.059425 Low: 22.89018 Precip: M Gust: 49 (8:19 AM) RH% Min/Max: 43-75 Feel Min/Max: 10 to 21 | 18 High: 24.130373 Low: 13.099989 Precip: M Gust: 26 (2:39 PM) RH% Min/Max: 43-64 Feel Min/Max: 1 to 13 | 19 High: 23.889223 Low: 11.550202 Precip: M Gust: 15 (12:59 AM) RH% Min/Max: 52-67 Feel Min/Max: -0 to 22 | 20 High: 22.159426 Low: 13.620192 Precip: M Gust: 32 (3:39 PM) RH% Min/Max: 64-91 Feel Min/Max: 3 to 11 | 21 High: 31.089222 Low: 19.959797 Precip: M Gust: 35 (10:19 AM) RH% Min/Max: 53-76 Feel Min/Max: 6 to 21 | 22 High: 38.10921 Low: 19.230799 Precip: M Gust: 16 (11:49 PM) RH% Min/Max: 42-80 Feel Min/Max: 12 to 38 |
| 23 High: 45.210224 Low: 28.340609 Precip: M Gust: 19 (2:39 PM) RH% Min/Max: 37-66 Feel Min/Max: 23 to 43 | 24 High: 53.740395 Low: 33.74061 Precip: M Gust: 20 (4:09 PM) RH% Min/Max: 40-61 Feel Min/Max: 30 to 54 | 25 High: 57.9308 Low: 41.210598 Precip: M Avg Wind: SW @ 6.4 Gust: 25 (3:10 PM) RH% Min/Max: 44-80 Feel Min/Max: 36 to 58 | 26 High: 57.590607 Low: 41.930588 Precip: M Gust: 20 (11:10 AM) RH% Min/Max: 43-90 Feel Min/Max: 39 to 58 | 27 Precip: M | 28 | 01 |
The data presented here provided by IEM API webservice: daily.json. A simple CSV option exists as well.
Daily High/Low Plot
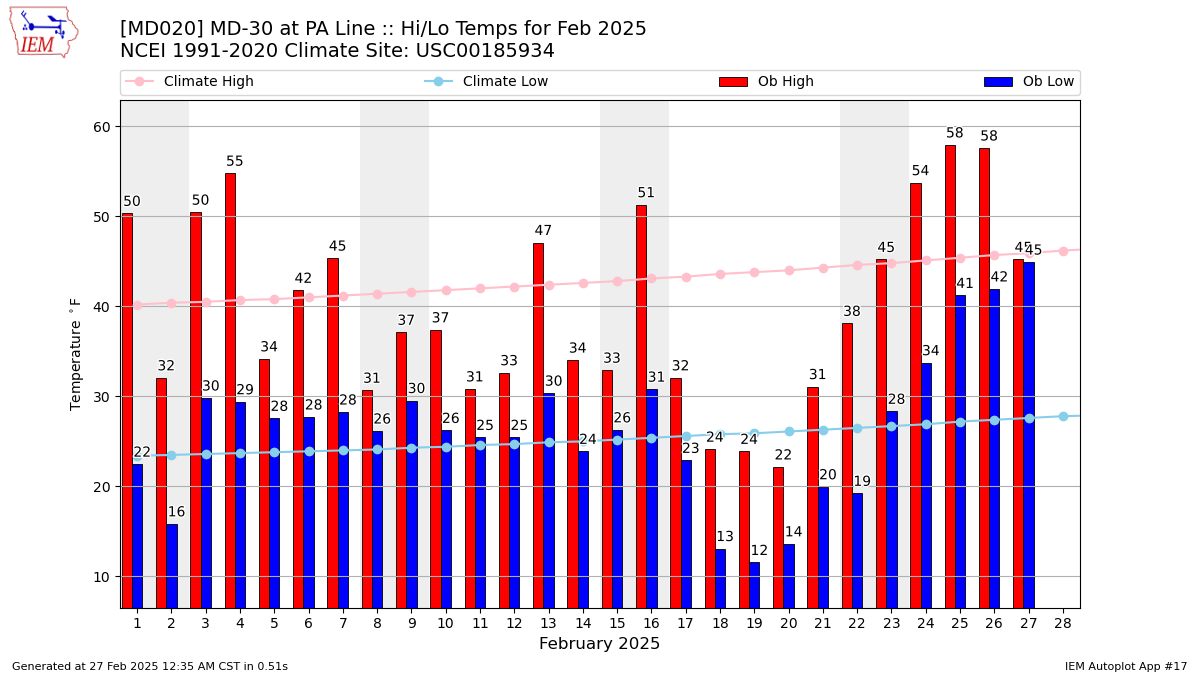
Description: This chart of the monthly temperature data. The bars are the observations and the dots are climatology.
Daily Rainfall

Description: This chart is of daily precipitation for the month. The red line would be an average month while the blue line and bars are observations.
Daily Average Wind Speeds
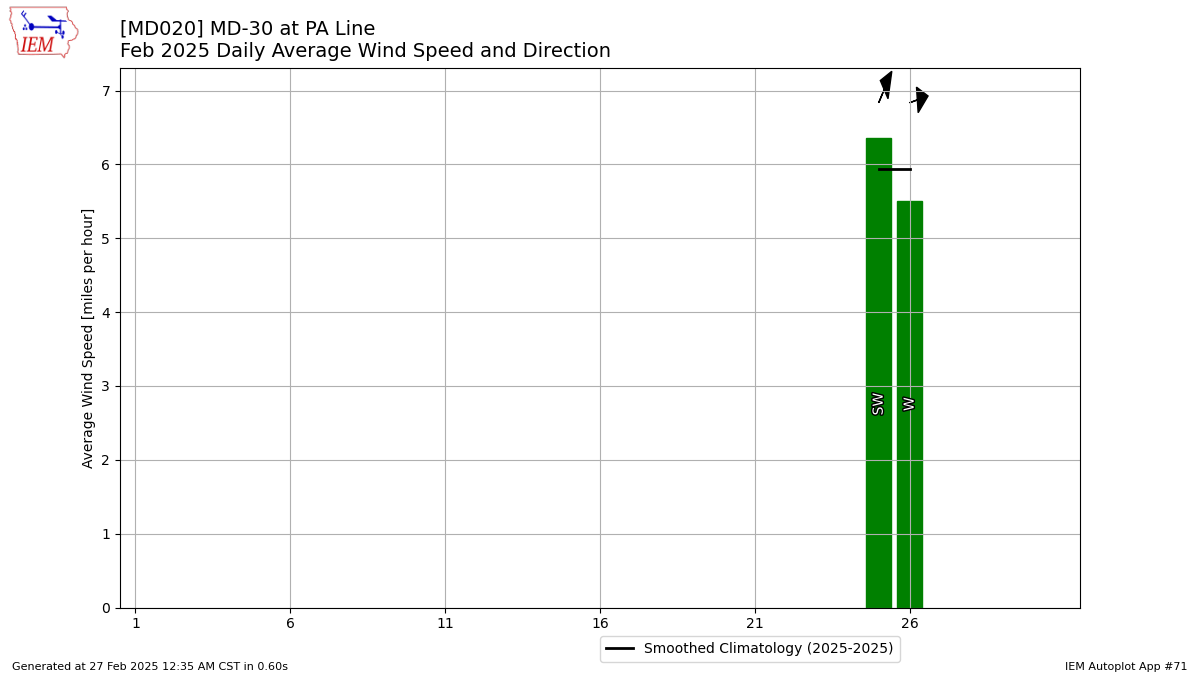
Description: This chart is of the daily average wind speeds.
The data presented here provided by IEM API webservice: daily.json. A simple CSV option exists as well.