Information Last Ob Photographs Calibration Meteogram Network Table Neighbors Monthly Summaries Observation History Wind Roses Custom Wind Roses Data Calendar
| Aug 2024 | Sep 2024 | Oct 2024 | ||||
|---|---|---|---|---|---|---|
| Sunday | Monday | Tuesday | Wednesday | Thursday | Friday | Saturday |
| 01 High: 77.144 Low: 57.5 Rain: 0.00 Gust: 16 (3:39 PM) RH% Min/Max: 44-100 Feel Min/Max: 55 to 77 | 02 High: 74.948 Low: 49.568 Rain: 0.00 Gust: 12 (3:52 PM) RH% Min/Max: 50-100 Feel Min/Max: 50 to 75 | 03 High: 77.108 Low: 46.562 Rain: 0.00 Gust: 12 (12:05 PM) RH% Min/Max: 44-100 Feel Min/Max: 47 to 77 | 04 High: 80.618 Low: 46.3316 Rain: 0.00 Gust: 10 (2:50 PM) RH% Min/Max: 45-100 Feel Min/Max: 46 to 82 | 05 High: 86.918 Low: 51.818 Rain: 0.00 Gust: 13 (12:57 PM) RH% Min/Max: 50-100 Feel Min/Max: 52 to 91 | 06 High: 74.156 Low: 53.3 Rain: 0.00 Gust: 17 (3:20 PM) RH% Min/Max: 44-99 Feel Min/Max: 50 to 74 | 07 High: 67.946 Low: 44.0798 Rain: 0.00 Gust: 16 (1:31 PM) RH% Min/Max: 34-100 Feel Min/Max: 43 to 68 |
| 08 High: 73.634 Low: 38.6528 Rain: 0.00 Gust: 9 (9:59 AM) RH% Min/Max: 39-100 Feel Min/Max: 38 to 74 | 09 High: 79.772 Low: 42.2042 Rain: 0.00 Gust: 10 (1:37 PM) RH% Min/Max: 38-97 Feel Min/Max: 41 to 80 | 10 High: 81.32 Low: 46.598 Rain: 0.00 Gust: 14 (2:07 PM) RH% Min/Max: 33-96 Feel Min/Max: 45 to 81 | 11 High: 86.558 Low: 48.776 Rain: 0.00 Gust: 12 (3:02 PM) RH% Min/Max: 39-96 Feel Min/Max: 49 to 87 | 12 High: 87.854 Low: 53.906 Rain: 0.00 Gust: 13 (1:45 PM) RH% Min/Max: 32-98 Feel Min/Max: 54 to 86 | 13 High: 79.934 Low: 58.604 Rain: 0.00 Gust: 14 (3:15 PM) RH% Min/Max: 58-100 Feel Min/Max: 59 to 80 | 14 High: 87.296 Low: 60.296 Rain: 0.00 Gust: 11 (2:25 PM) RH% Min/Max: 57-100 Feel Min/Max: 60 to 93 |
| 15 High: 90.374 Low: 61.25 Rain: 0.00 Gust: 11 (3:59 PM) RH% Min/Max: 43-100 Feel Min/Max: 61 to 94 | 16 High: 87.926 Low: 58.676 Rain: 0.00 Gust: 12 (10:58 AM) RH% Min/Max: 47-100 Feel Min/Max: 59 to 91 | 17 High: 89.744 Low: 56.84 Rain: 0.00 Gust: 11 (12:39 PM) RH% Min/Max: 33-98 Feel Min/Max: 57 to 89 | 18 High: 90.068 Low: 52.97 Rain: 0.00 Gust: 11 (1:26 PM) RH% Min/Max: 39-95 Feel Min/Max: 53 to 92 | 19 High: 92.336 Low: 60.134 Rain: 0.00 Gust: 16 (12:32 PM) RH% Min/Max: 43-90 Feel Min/Max: 60 to 96 | 20 High: 93.11 Low: 62.096 Rain: 0.00 Gust: 13 (2:07 AM) RH% Min/Max: 26-99 Feel Min/Max: 62 to 91 | 21 High: 84.308 Low: 59.828 Rain: 0.23 Gust: 18 (11:17 AM) RH% Min/Max: 60-96 Feel Min/Max: 60 to 89 |
| 22 High: 69.89 Low: 60.116 Rain: 0.44 Gust: 14 (1:28 AM) RH% Min/Max: 78-100 Feel Min/Max: 60 to 70 | 23 High: 63.914 Low: 56.228 Rain: 0.00 Gust: 11 (9:19 AM) RH% Min/Max: 80-100 Feel Min/Max: 56 to 64 | 24 High: 72.806 Low: 57.47 Rain: 0.21 Gust: 12 (4:26 PM) RH% Min/Max: 55-100 Feel Min/Max: 57 to 73 | 25 High: 79.268 Low: 49.766 Rain: 0.00 Gust: 13 (3:25 PM) RH% Min/Max: 42-100 Feel Min/Max: 50 to 79 | 26 High: 80.258 Low: 50.954 Rain: 0.00 Gust: 12 (2:57 PM) RH% Min/Max: 42-100 Feel Min/Max: 51 to 80 | 27 High: 73.994 Low: 56.84 Rain: 0.00 Gust: 19 (12:34 PM) RH% Min/Max: 44-92 Feel Min/Max: 57 to 74 | 28 High: 83.822 Low: 58.55 Rain: 0.00 Gust: 22 (2:03 PM) RH% Min/Max: 35-87 Feel Min/Max: 59 to 83 |
| 29 High: 66.848 Low: 55.544 Rain: Gust: 10 (8:43 AM) RH% Min/Max: 64-91 Feel Min/Max: 56 to 67 | 30 High: M Low: M Rain: | 01 | 02 | 03 | 04 | 05 |
The data presented here provided by IEM API webservice: daily.json. A simple CSV option exists as well.
Daily High/Low Plot
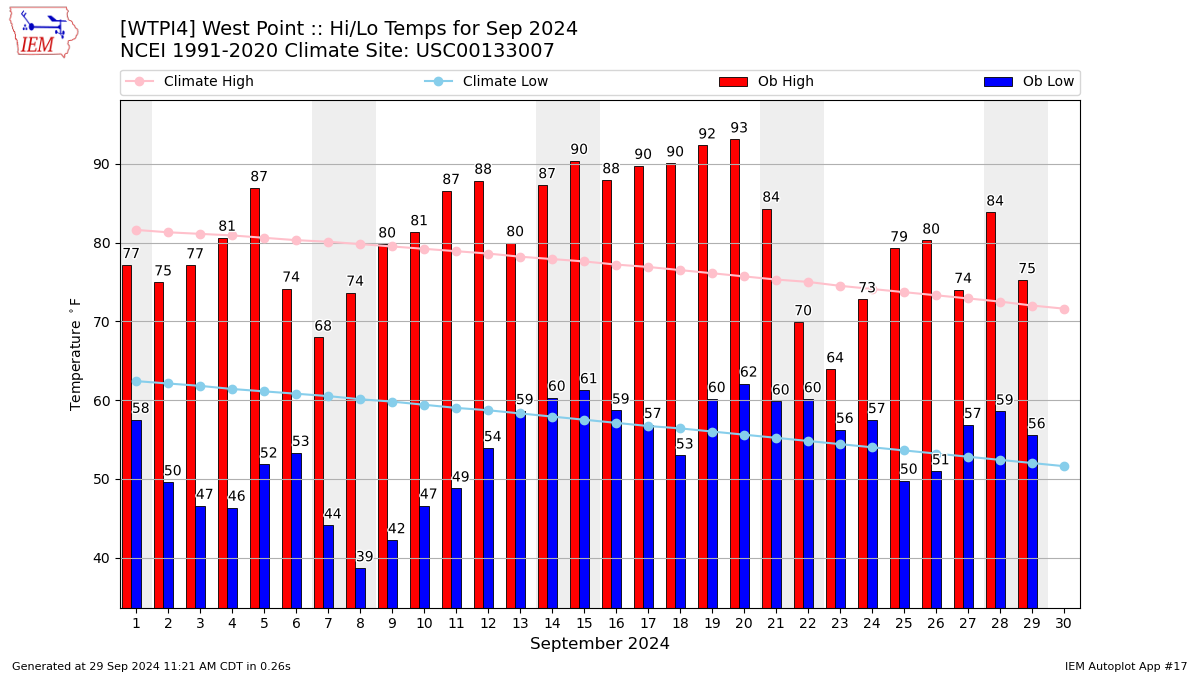
Description: This chart of the monthly temperature data. The bars are the observations and the dots are climatology.
Daily Rainfall

Description: This chart is of daily precipitation for the month. The red line would be an average month while the blue line and bars are observations.
Daily Average Wind Speeds

Description: This chart is of the daily average wind speeds.
The data presented here provided by IEM API webservice: daily.json. A simple CSV option exists as well.